
Page 26 - Computing E-Book Grade 6
P. 26
The City School 2021-2022
1.4. Preparing Data for Analysis
Charts allow you to illustrate your workbook
data graphically, which makes it easy to visualize
comparisons and trends. In previous levels, we have
The estimated amount of data on
covered the basics of how to insert charts in excel. the internet created daily will be
The purpose of this section is to familiarize you with 463 exabytes* in 2025.
the advance features of charts in Excel. * an exabyte is 1,000 bytes to the sixth power.
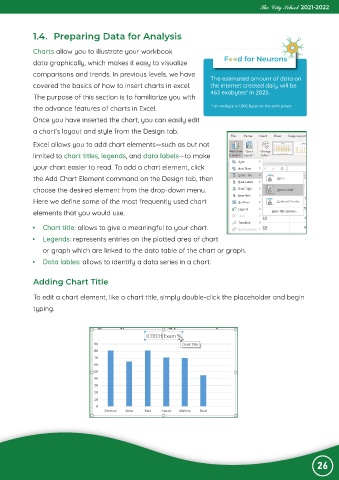
Once you have inserted the chart, you can easily edit
a chart’s layout and style from the Design tab.
Excel allows you to add chart elements—such as but not
limited to chart titles, legends, and data labels—to make
your chart easier to read. To add a chart element, click
the Add Chart Element command on the Design tab, then
choose the desired element from the drop-down menu.
Here we define some of the most frequently used chart
elements that you would use.
• Chart title: allows to give a meaningful to your chart.
• Legends: represents entries on the plotted area of chart
or graph which are linked to the data table of the chart or graph.
• Data lables: allows to identify a data series in a chart.
Adding Chart Title
To edit a chart element, like a chart title, simply double-click the placeholder and begin
typing.
26