
Page 121 - Applied Statistics with R
P. 121
7.7. HISTORY 121
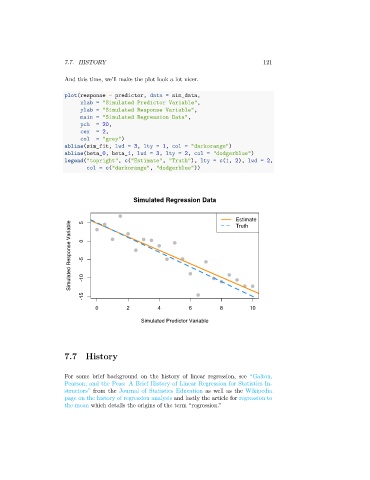
And this time, we’ll make the plot look a lot nicer.
plot(response ~ predictor, data = sim_data,
xlab = "Simulated Predictor Variable",
ylab = "Simulated Response Variable",
main = "Simulated Regression Data",
pch = 20,
cex = 2,
col = "grey")
abline(sim_fit, lwd = 3, lty = 1, col = "darkorange")
abline(beta_0, beta_1, lwd = 3, lty = 2, col = "dodgerblue")
legend("topright", c("Estimate", "Truth"), lty = c(1, 2), lwd = 2,
col = c("darkorange", "dodgerblue"))
Simulated Regression Data
Estimate
Simulated Response Variable 0 -5
5
Truth
-15 -10
0 2 4 6 8 10
Simulated Predictor Variable
7.7 History
For some brief background on the history of linear regression, see “Galton,
Pearson, and the Peas: A Brief History of Linear Regression for Statistics In-
structors” from the Journal of Statistics Education as well as the Wikipedia
page on the history of regression analysis and lastly the article for regression to
the mean which details the origins of the term “regression.”