
Page 148 - Applied Statistics with R
P. 148
148 CHAPTER 8. INFERENCE FOR SIMPLE LINEAR REGRESSION
lines(speed_grid, dist_pi_band[,"lwr"], col = "dodgerblue", lwd = 3, lty = 3)
lines(speed_grid, dist_pi_band[,"upr"], col = "dodgerblue", lwd = 3, lty = 3)
points(mean(cars$speed), mean(cars$dist), pch = "+", cex = 3)
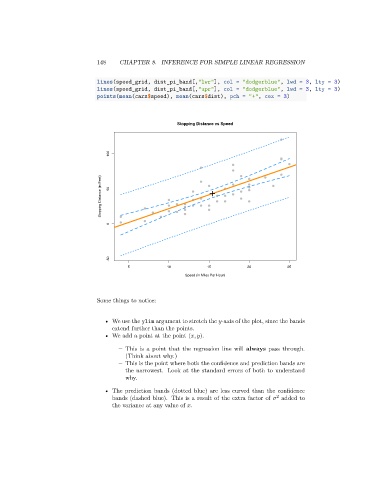
Stopping Distance vs Speed
100
Stopping Distance (in Feet) 50 +
0
-50
5 10 15 20 25
Speed (in Miles Per Hour)
Some things to notice:
• We use the ylim argument to stretch the -axis of the plot, since the bands
extend further than the points.
• We add a point at the point ( ̄ , ̄).
– This is a point that the regression line will always pass through.
(Think about why.)
– This is the point where both the confidence and prediction bands are
the narrowest. Look at the standard errors of both to understand
why.
• The prediction bands (dotted blue) are less curved than the confidence
2
bands (dashed blue). This is a result of the extra factor of added to
the variance at any value of .