
Page 151 - Applied Statistics with R
P. 151
8.11. R MARKDOWN 151
## Residuals 48 11354 236.5
## ---
## Signif. codes: 0 '***' 0.001 '**' 0.01 '*' 0.05 '.' 0.1 ' ' 1
This also gives a p-value for the test. You should notice that the p-value from
the test was the same. You might also notice that the value of the test statistic
for the test, 9.46399, can be squared to obtain the value of the statistic,
89.5671065.
Note that there is another equivalent way to do this in R, which we will return
to often to compare two models.
anova(lm(dist ~ 1, data = cars), lm(dist ~ speed, data = cars))
## Analysis of Variance Table
##
## Model 1: dist ~ 1
## Model 2: dist ~ speed
## Res.Df RSS Df Sum of Sq F Pr(>F)
## 1 49 32539
## 2 48 11354 1 21186 89.567 1.49e-12 ***
## ---
## Signif. codes: 0 '***' 0.001 '**' 0.01 '*' 0.05 '.' 0.1 ' ' 1
The model statement lm(dist ~ 1, data = cars) applies the model =
+ to the cars data. Note that ̂ = ̄ when = + .
0
0
The model statement lm(dist ~ speed, data = cars) applies the model =
+ + .
0
1
We can then think of this usage of anova() as directly comparing the two
models. (Notice we get the same p-value again.)
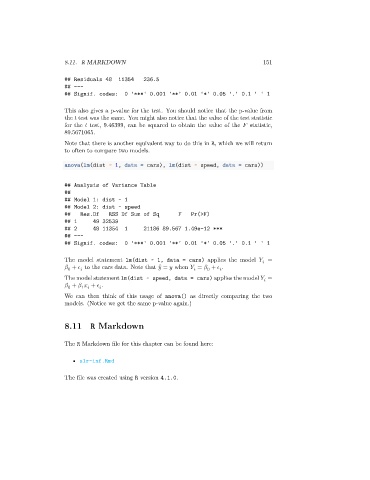
8.11 R Markdown
The R Markdown file for this chapter can be found here:
• slr-inf.Rmd
The file was created using R version 4.1.0.