
Page 200 - Applied Statistics with R
P. 200
200 CHAPTER 11. CATEGORICAL PREDICTORS AND INTERACTIONS
So, to fit the above model, we do so like any other multiple regression model we
have seen before.
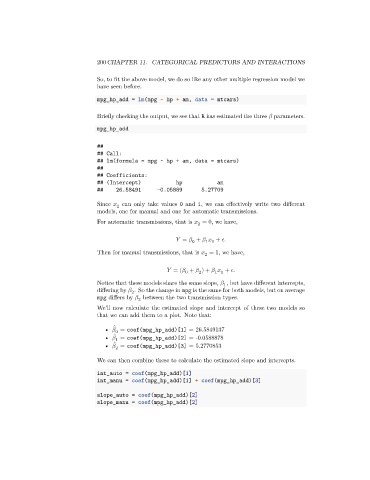
mpg_hp_add = lm(mpg ~ hp + am, data = mtcars)
Briefly checking the output, we see that R has estimated the three parameters.
mpg_hp_add
##
## Call:
## lm(formula = mpg ~ hp + am, data = mtcars)
##
## Coefficients:
## (Intercept) hp am
## 26.58491 -0.05889 5.27709
Since can only take values 0 and 1, we can effectively write two different
2
models, one for manual and one for automatic transmissions.
For automatic transmissions, that is = 0, we have,
2
= + + .
1 1
0
Then for manual transmissions, that is = 1, we have,
2
= ( + ) + + .
1 1
2
0
Notice that these models share the same slope, , but have different intercepts,
1
differing by . So the change in mpg is the same for both models, but on average
2
mpg differs by between the two transmission types.
2
We’ll now calculate the estimated slope and intercept of these two models so
that we can add them to a plot. Note that:
̂
• = coef(mpg_hp_add)[1] = 26.5849137
0
̂
• = coef(mpg_hp_add)[2] = -0.0588878
1
̂
• = coef(mpg_hp_add)[3] = 5.2770853
2
We can then combine these to calculate the estimated slope and intercepts.
int_auto = coef(mpg_hp_add)[1]
int_manu = coef(mpg_hp_add)[1] + coef(mpg_hp_add)[3]
slope_auto = coef(mpg_hp_add)[2]
slope_manu = coef(mpg_hp_add)[2]