
Page 205 - Applied Statistics with R
P. 205
11.2. INTERACTIONS 205
int_dom = coef(mpg_disp_add)[1] + coef(mpg_disp_add)[3]
slope_for = coef(mpg_disp_add)[2]
slope_dom = coef(mpg_disp_add)[2]
plot(mpg ~ disp, data = autompg, col = domestic + 1, pch = domestic + 1)
abline(int_for, slope_for, col = 1, lty = 1, lwd = 2) # add line for foreign cars
abline(int_dom, slope_dom, col = 2, lty = 2, lwd = 2) # add line for domestic cars
legend("topright", c("Foreign", "Domestic"), pch = c(1, 2), col = c(1, 2))
Foreign
Domestic
40
mpg 30
20
10
100 200 300 400
disp
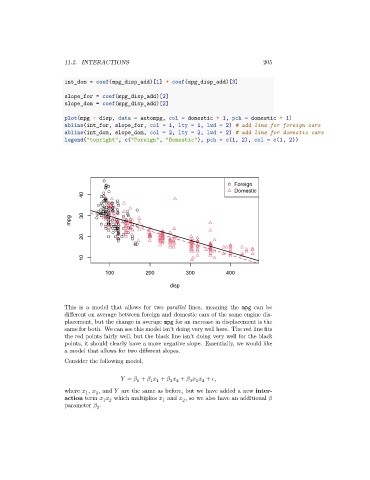
This is a model that allows for two parallel lines, meaning the mpg can be
different on average between foreign and domestic cars of the same engine dis-
placement, but the change in average mpg for an increase in displacement is the
same for both. We can see this model isn’t doing very well here. The red line fits
the red points fairly well, but the black line isn’t doing very well for the black
points, it should clearly have a more negative slope. Essentially, we would like
a model that allows for two different slopes.
Consider the following model,
= + + + + ,
0
2 2
1 1
3 1 2
where , , and are the same as before, but we have added a new inter-
1
2
action term which multiplies and , so we also have an additional
2
1
1 2
parameter .
3