
Page 202 - Applied Statistics with R
P. 202
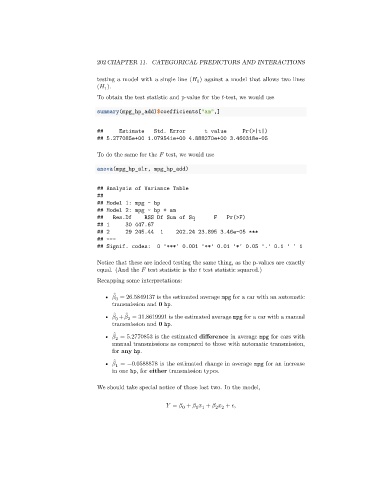
202 CHAPTER 11. CATEGORICAL PREDICTORS AND INTERACTIONS


                                 testing a model with a single line (   ) against a model that allows two lines
                                                                  0
                                 (   ).
                                    1
                                 To obtain the test statistic and p-value for the   -test, we would use
                                 summary(mpg_hp_add)$coefficients["am",]


                                 ##     Estimate    Std. Error       t value     Pr(>|t|)
                                 ## 5.277085e+00 1.079541e+00 4.888270e+00 3.460318e-05

                                 To do the same for the    test, we would use

                                 anova(mpg_hp_slr, mpg_hp_add)


                                 ## Analysis of Variance Table
                                 ##
                                 ## Model 1: mpg ~ hp
                                 ## Model 2: mpg ~ hp + am
                                 ##   Res.Df     RSS Df Sum of Sq       F   Pr(>F)
                                 ## 1      30 447.67
                                 ## 2      29 245.44  1    202.24 23.895 3.46e-05 ***
                                 ## ---
                                 ## Signif. codes:   0 '***' 0.001 '**' 0.01 '*' 0.05 '.' 0.1 ' ' 1


                                 Notice that these are indeed testing the same thing, as the p-values are exactly
                                 equal. (And the    test statistic is the    test statistic squared.)
                                 Recapping some interpretations:

                                        ̂
                                    •    = 26.5849137 is the estimated average mpg for a car with an automatic
                                       0
                                      transmission and 0 hp.
                                            ̂
                                        ̂
                                    •    +   = 31.8619991 is the estimated average mpg for a car with a manual
                                       0
                                           2
                                      transmission and 0 hp.
                                        ̂
                                    •    = 5.2770853 is the estimated difference in average mpg for cars with
                                       2
                                      manual transmissions as compared to those with automatic transmission,
                                      for any hp.
                                        ̂
                                    •    = −0.0588878 is the estimated change in average mpg for an increase
                                       1
                                      in one hp, for either transmission types.
                                 We should take special notice of those last two. In the model,


                                                           =    +       +       +   ,
                                                                        2 2
                                                             0
                                                                  1 1