
Page 217 - Applied Statistics with R
P. 217
11.3. FACTOR VARIABLES 217
• + is the average mpg for a 8 cylinder car with 0 disp.
3
0
So because 4 cylinder is the reference level, is specific to 4 cylinders, but 2
0
and are used to represent quantities relative to 4 cylinders.
3
As we have done before, we can extract these intercepts and slopes for the three
lines, and plot them accordingly.
int_4cyl = coef(mpg_disp_add_cyl)[1]
int_6cyl = coef(mpg_disp_add_cyl)[1] + coef(mpg_disp_add_cyl)[3]
int_8cyl = coef(mpg_disp_add_cyl)[1] + coef(mpg_disp_add_cyl)[4]
slope_all_cyl = coef(mpg_disp_add_cyl)[2]
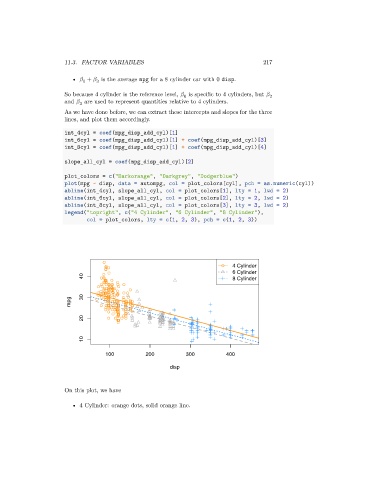
plot_colors = c("Darkorange", "Darkgrey", "Dodgerblue")
plot(mpg ~ disp, data = autompg, col = plot_colors[cyl], pch = as.numeric(cyl))
abline(int_4cyl, slope_all_cyl, col = plot_colors[1], lty = 1, lwd = 2)
abline(int_6cyl, slope_all_cyl, col = plot_colors[2], lty = 2, lwd = 2)
abline(int_8cyl, slope_all_cyl, col = plot_colors[3], lty = 3, lwd = 2)
legend("topright", c("4 Cylinder", "6 Cylinder", "8 Cylinder"),
col = plot_colors, lty = c(1, 2, 3), pch = c(1, 2, 3))
4 Cylinder
6 Cylinder
40 8 Cylinder
mpg 30
20
10
100 200 300 400
disp
On this plot, we have
• 4 Cylinder: orange dots, solid orange line.