
Page 221 - Applied Statistics with R
P. 221
11.4. PARAMETERIZATION 221
## [1] 2
We see there is a difference of two parameters, which is also displayed in the
resulting ANOVA table from R. Notice that the following two values also appear
on the ANOVA table.
nrow(autompg) - length(coef(mpg_disp_int_cyl))
## [1] 377
nrow(autompg) - length(coef(mpg_disp_add_cyl))
## [1] 379
11.4 Parameterization
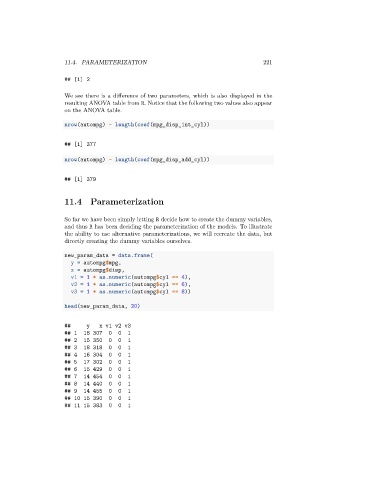
So far we have been simply letting R decide how to create the dummy variables,
and thus R has been deciding the parameterization of the models. To illustrate
the ability to use alternative parameterizations, we will recreate the data, but
directly creating the dummy variables ourselves.
new_param_data = data.frame(
y = autompg$mpg,
x = autompg$disp,
v1 = 1 * as.numeric(autompg$cyl == 4),
v2 = 1 * as.numeric(autompg$cyl == 6),
v3 = 1 * as.numeric(autompg$cyl == 8))
head(new_param_data, 20)
## y x v1 v2 v3
## 1 18 307 0 0 1
## 2 15 350 0 0 1
## 3 18 318 0 0 1
## 4 16 304 0 0 1
## 5 17 302 0 0 1
## 6 15 429 0 0 1
## 7 14 454 0 0 1
## 8 14 440 0 0 1
## 9 14 455 0 0 1
## 10 15 390 0 0 1
## 11 15 383 0 0 1