
Page 280 - Applied Statistics with R
P. 280
280 CHAPTER 13. MODEL DIAGNOSTICS
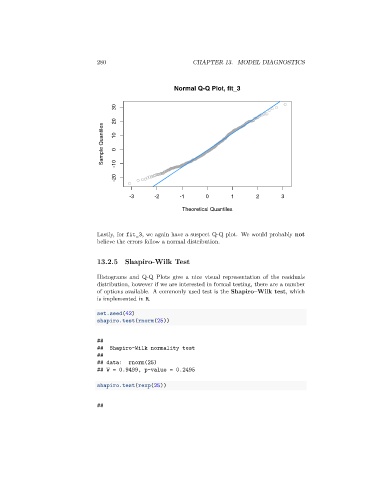
Normal Q-Q Plot, fit_3
30
20
Sample Quantiles 10 0
-20 -10
-3 -2 -1 0 1 2 3
Theoretical Quantiles
Lastly, for fit_3, we again have a suspect Q-Q plot. We would probably not
believe the errors follow a normal distribution.
13.2.5 Shapiro-Wilk Test
Histograms and Q-Q Plots give a nice visual representation of the residuals
distribution, however if we are interested in formal testing, there are a number
of options available. A commonly used test is the Shapiro–Wilk test, which
is implemented in R.
set.seed(42)
shapiro.test(rnorm(25))
##
## Shapiro-Wilk normality test
##
## data: rnorm(25)
## W = 0.9499, p-value = 0.2495
shapiro.test(rexp(25))
##