
Page 278 - Applied Statistics with R
P. 278
278 CHAPTER 13. MODEL DIAGNOSTICS
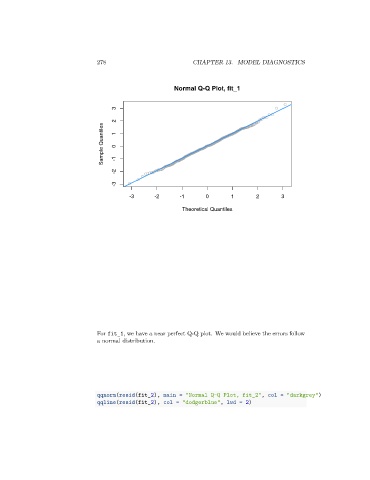
Normal Q-Q Plot, fit_1
3
2
Sample Quantiles 1 0
-2 -1
-3
-3 -2 -1 0 1 2 3
Theoretical Quantiles
For fit_1, we have a near perfect Q-Q plot. We would believe the errors follow
a normal distribution.
qqnorm(resid(fit_2), main = "Normal Q-Q Plot, fit_2", col = "darkgrey")
qqline(resid(fit_2), col = "dodgerblue", lwd = 2)