
Page 281 - Applied Statistics with R
P. 281
13.2. CHECKING ASSUMPTIONS 281
## Shapiro-Wilk normality test
##
## data: rexp(25)
## W = 0.71164, p-value = 1.05e-05
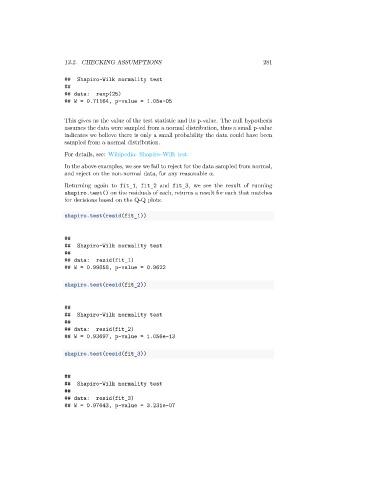
This gives us the value of the test statistic and its p-value. The null hypothesis
assumes the data were sampled from a normal distribution, thus a small p-value
indicates we believe there is only a small probability the data could have been
sampled from a normal distribution.
For details, see: Wikipedia: Shapiro–Wilk test.
In the above examples, we see we fail to reject for the data sampled from normal,
and reject on the non-normal data, for any reasonable .
Returning again to fit_1, fit_2 and fit_3, we see the result of running
shapiro.test() on the residuals of each, returns a result for each that matches
for decisions based on the Q-Q plots.
shapiro.test(resid(fit_1))
##
## Shapiro-Wilk normality test
##
## data: resid(fit_1)
## W = 0.99858, p-value = 0.9622
shapiro.test(resid(fit_2))
##
## Shapiro-Wilk normality test
##
## data: resid(fit_2)
## W = 0.93697, p-value = 1.056e-13
shapiro.test(resid(fit_3))
##
## Shapiro-Wilk normality test
##
## data: resid(fit_3)
## W = 0.97643, p-value = 3.231e-07