
Page 295 - Applied Statistics with R
P. 295
13.4. DATA ANALYSIS EXAMPLES 295
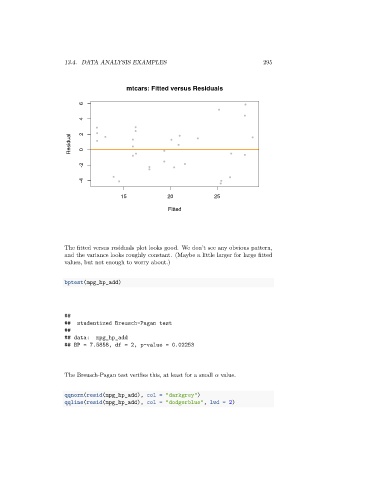
mtcars: Fitted versus Residuals
6
4
Residual 2 0
-2
-4
15 20 25
Fitted
The fitted versus residuals plot looks good. We don’t see any obvious pattern,
and the variance looks roughly constant. (Maybe a little larger for large fitted
values, but not enough to worry about.)
bptest(mpg_hp_add)
##
## studentized Breusch-Pagan test
##
## data: mpg_hp_add
## BP = 7.5858, df = 2, p-value = 0.02253
The Breusch-Pagan test verifies this, at least for a small value.
qqnorm(resid(mpg_hp_add), col = "darkgrey")
qqline(resid(mpg_hp_add), col = "dodgerblue", lwd = 2)