Page 296 - Applied Statistics with R
P. 296

296                             CHAPTER 13. MODEL DIAGNOSTICS
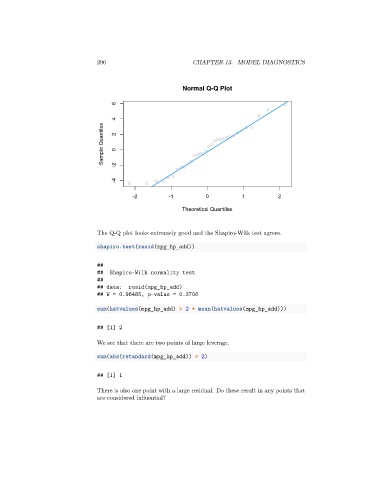


                                                             Normal Q-Q Plot

                                       6

                                       4
                                   Sample Quantiles  2  0


                                       -4  -2

                                             -2          -1          0           1           2

                                                             Theoretical Quantiles


                                 The Q-Q plot looks extremely good and the Shapiro-Wilk test agrees.

                                 shapiro.test(resid(mpg_hp_add))


                                 ##
                                 ##  Shapiro-Wilk normality test
                                 ##
                                 ## data:   resid(mpg_hp_add)
                                 ## W = 0.96485, p-value = 0.3706

                                 sum(hatvalues(mpg_hp_add) > 2 * mean(hatvalues(mpg_hp_add)))


                                 ## [1] 2

                                 We see that there are two points of large leverage.

                                 sum(abs(rstandard(mpg_hp_add)) > 2)


                                 ## [1] 1

                                 There is also one point with a large residual. Do these result in any points that
                                 are considered influential?
   291   292   293   294   295   296   297   298   299   300   301