
Page 298 - Applied Statistics with R
P. 298
298 CHAPTER 13. MODEL DIAGNOSTICS
Residuals vs Fitted Normal Q-Q
6 Toyota Corolla Toyota Corolla
Lotus Europa 2 Lotus Europa
Fiat 128 Fiat 128
4 1
Residuals 2 0 Standardized residuals 0
-2
-1
-4
15 20 25 -2 -1 0 1 2
Fitted values Theoretical Quantiles
Scale-Location Residuals vs Leverage
1.5 Toyota Corolla
Lotus Europa Toyota Corolla 1
2
Fiat 128 Fiat 128 Maserati Bora 0.5
Standardized residuals 1.0 0.5 Standardized residuals 1 0
-1
0.5
0.0 -2 Cook's distance
15 20 25 0.0 0.1 0.2 0.3 0.4
Fitted values Leverage
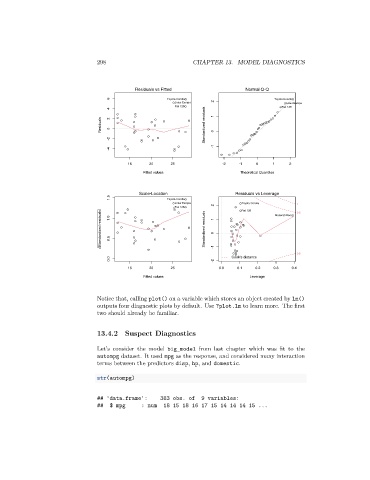
Notice that, calling plot() on a variable which stores an object created by lm()
outputs four diagnostic plots by default. Use ?plot.lm to learn more. The first
two should already be familiar.
13.4.2 Suspect Diagnostics
Let’s consider the model big_model from last chapter which was fit to the
autompg dataset. It used mpg as the response, and considered many interaction
terms between the predictors disp, hp, and domestic.
str(autompg)
## 'data.frame': 383 obs. of 9 variables:
## $ mpg : num 18 15 18 16 17 15 14 14 14 15 ...