Page 300 - Applied Statistics with R
P. 300

300                             CHAPTER 13. MODEL DIAGNOSTICS


                                 big_mod_cd = cooks.distance(big_model)
                                 sum(big_mod_cd > 4 / length(big_mod_cd))


                                 ## [1] 31

                                 Here, we find 31, so perhaps removing them will help!

                                 big_model_fix = lm(mpg ~ disp * hp * domestic,
                                                     data = autompg,
                                                     subset = big_mod_cd < 4 / length(big_mod_cd))
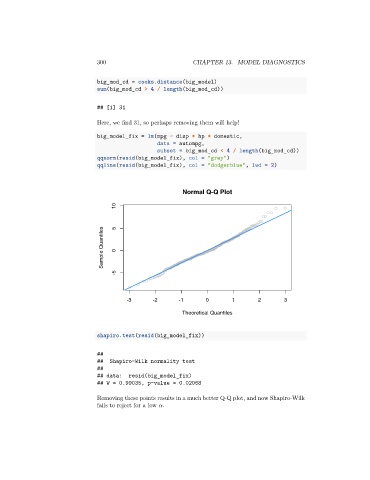
                                 qqnorm(resid(big_model_fix), col = "grey")
                                 qqline(resid(big_model_fix), col = "dodgerblue", lwd = 2)


                                                             Normal Q-Q Plot

                                       10


                                   Sample Quantiles  5  0


                                       -5


                                           -3       -2      -1       0        1       2        3

                                                             Theoretical Quantiles


                                 shapiro.test(resid(big_model_fix))

                                 ##
                                 ##  Shapiro-Wilk normality test
                                 ##
                                 ## data:   resid(big_model_fix)
                                 ## W = 0.99035, p-value = 0.02068


                                 Removing these points results in a much better Q-Q plot, and now Shapiro-Wilk
                                 fails to reject for a low   .
   295   296   297   298   299   300   301   302   303   304   305