
Page 337 - Applied Statistics with R
P. 337
14.2. PREDICTOR TRANSFORMATION 337
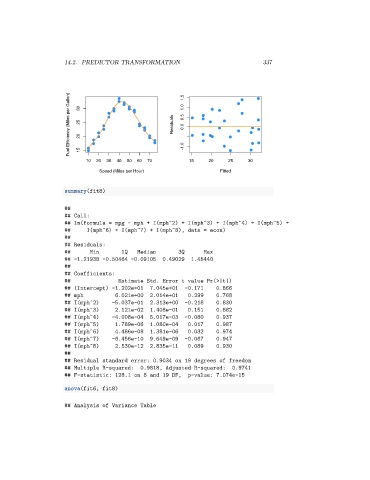
Fuel Efficiency (Miles per Gallon) 30 25 20 Residuals 1.5 1.0 0.5 0.0
15
10 20 30 40 50 60 70 -1.0 15 20 25 30
Speed (Miles per Hour) Fitted
summary(fit8)
##
## Call:
## lm(formula = mpg ~ mph + I(mph^2) + I(mph^3) + I(mph^4) + I(mph^5) +
## I(mph^6) + I(mph^7) + I(mph^8), data = econ)
##
## Residuals:
## Min 1Q Median 3Q Max
## -1.21938 -0.50464 -0.09105 0.49029 1.45440
##
## Coefficients:
## Estimate Std. Error t value Pr(>|t|)
## (Intercept) -1.202e+01 7.045e+01 -0.171 0.866
## mph 6.021e+00 2.014e+01 0.299 0.768
## I(mph^2) -5.037e-01 2.313e+00 -0.218 0.830
## I(mph^3) 2.121e-02 1.408e-01 0.151 0.882
## I(mph^4) -4.008e-04 5.017e-03 -0.080 0.937
## I(mph^5) 1.789e-06 1.080e-04 0.017 0.987
## I(mph^6) 4.486e-08 1.381e-06 0.032 0.974
## I(mph^7) -6.456e-10 9.649e-09 -0.067 0.947
## I(mph^8) 2.530e-12 2.835e-11 0.089 0.930
##
## Residual standard error: 0.9034 on 19 degrees of freedom
## Multiple R-squared: 0.9818, Adjusted R-squared: 0.9741
## F-statistic: 128.1 on 8 and 19 DF, p-value: 7.074e-15
anova(fit6, fit8)
## Analysis of Variance Table