
Page 332 - Applied Statistics with R
P. 332
332 CHAPTER 14. TRANSFORMATIONS
fit3 = lm(mpg ~ mph + I(mph ^ 2) + I(mph ^ 3), data = econ)
summary(fit3)
##
## Call:
## lm(formula = mpg ~ mph + I(mph^2) + I(mph^3), data = econ)
##
## Residuals:
## Min 1Q Median 3Q Max
## -2.8112 -0.9677 0.0264 1.0345 3.3827
##
## Coefficients:
## Estimate Std. Error t value Pr(>|t|)
## (Intercept) 2.258e+00 2.768e+00 0.816 0.4227
## mph 1.291e+00 2.529e-01 5.103 3.2e-05 ***
## I(mph^2) -1.502e-02 6.604e-03 -2.274 0.0322 *
## I(mph^3) 4.066e-06 5.132e-05 0.079 0.9375
## ---
## Signif. codes: 0 '***' 0.001 '**' 0.01 '*' 0.05 '.' 0.1 ' ' 1
##
## Residual standard error: 1.697 on 24 degrees of freedom
## Multiple R-squared: 0.9188, Adjusted R-squared: 0.9087
## F-statistic: 90.56 on 3 and 24 DF, p-value: 3.17e-13
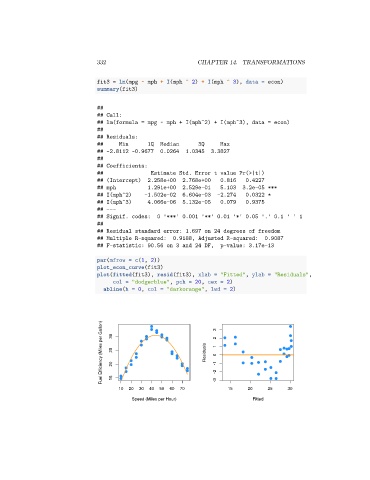
par(mfrow = c(1, 2))
plot_econ_curve(fit3)
plot(fitted(fit3), resid(fit3), xlab = "Fitted", ylab = "Residuals",
col = "dodgerblue", pch = 20, cex = 2)
abline(h = 0, col = "darkorange", lwd = 2)
Fuel Efficiency (Miles per Gallon) 30 25 20 Residuals 3 2 1 0 -1
15
10 20 30 40 50 60 70 -2 -3 15 20 25 30
Speed (Miles per Hour) Fitted