Page 63 - Applied Statistics with R
P. 63

4.2. PLOTTING                                                      63


                             45

                             40

                             35
                             30

                             25
                             20

                             15


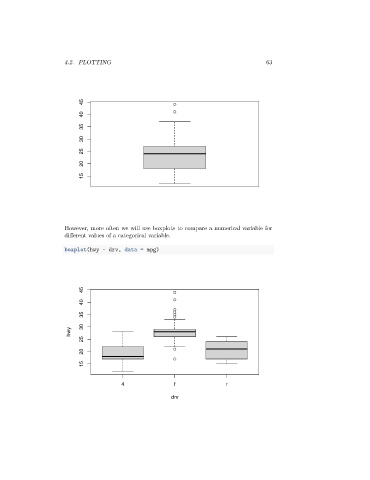
                      However, more often we will use boxplots to compare a numerical variable for
                      different values of a categorical variable.

                      boxplot(hwy ~ drv, data = mpg)


                             45

                             40
                             35

                             30
                        hwy
                             25

                             20
                             15


                                         4                 f                r
                                                          drv
   58   59   60   61   62   63   64   65   66   67   68