
Page 65 - Applied Statistics with R
P. 65
4.2. PLOTTING 65
just used with a boxplot. (The function plot() can also be used more generally;
see the documentation for details.)
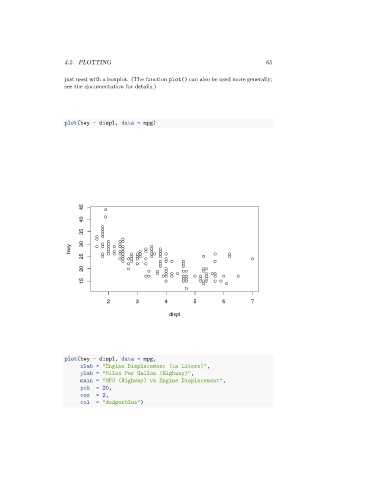
plot(hwy ~ displ, data = mpg)
45
40
35
hwy 30
25
20
15
2 3 4 5 6 7
displ
plot(hwy ~ displ, data = mpg,
xlab = "Engine Displacement (in Liters)",
ylab = "Miles Per Gallon (Highway)",
main = "MPG (Highway) vs Engine Displacement",
pch = 20,
cex = 2,
col = "dodgerblue")