Page 302 - First Aid for the USMLE Step 1 2020, Thirtieth edition [MedicalBooksVN.com]_Neat
P. 302

a/c  ad
                                                                                            Odds ratio =  =
                                                                                                     b/d  bc
                                                                                                     a/(a + b)
            258         SectiOn ii    Public HealtH ScienceS  ` PUBLIC HEALTH SCIENCES—EPIdEmIoLogy ANd BIoSTATISTICS                    Public HealtH ScienceS  ` PUBLIC HEALTH SCIENCES—EPIdEmIoLogy ANd BIoSTATISTICS
                                                                                           Relative risk =
                                                                                                     c/(c + d)
                                                                                                      a     c
                                                                                        Attributable risk =
                                                                                                     a + b  c + d
                                                                                                Disease or outcome
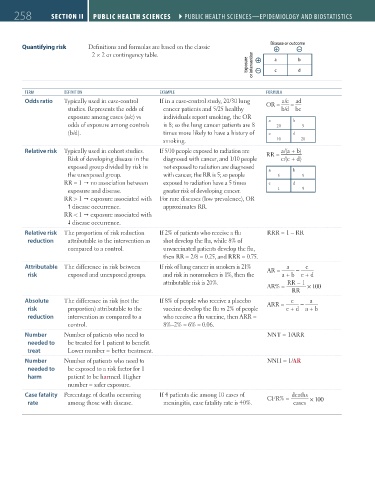
               Quantifying risk     Definitions and formulas are based on the classic
                                      2 × 2 or contingency table.                                a       b
                                                                                        Exposure  or intervention  c  d


                TERm         dEFINITIoN                     EXAmPLE                            FoRmULA
                Odds ratio   Typically used in case-control   If in a case-control study, 20/30 lung   OR =  a/c   ad
                                                                                                      =
                              studies. Represents the odds of   cancer patients and 5/25 healthy       b/d    bc
                              exposure among cases (a/c) vs   individuals report smoking, the OR   a   b
                              odds of exposure among controls   is 8; so the lung cancer patients are 8   20  5
                              (b/d).                         times more likely to have a history of   c  d
                                                             smoking.                             10      20
                Relative risk  Typically used in cohort studies.   If 5/10 people exposed to radiation are   RR =  a/(a + b)
                              Risk of developing disease in the   diagnosed with cancer, and 1/10 people       c/(c + d)
                              exposed group divided by risk in   not exposed to radiation are diagnosed   a  b
                              the unexposed group.           with cancer, the RR is 5; so people   5      5
                             RR = 1 Ž no association between   exposed to radiation have a 5 times   c  d
                              exposure and disease.          greater risk of developing cancer.   1       9
                             RR > 1 Ž exposure associated with   For rare diseases (low prevalence), OR
                               disease occurrence.          approximates RR.
                             RR < 1 Ž exposure associated with
                               disease occurrence.
                Relative risk  The proportion of risk reduction   If 2% of patients who receive a flu   RRR = 1 − RR
                 reduction    attributable to the intervention as   shot develop the flu, while 8% of
                              compared to a control.         unvaccinated patients develop the flu,
                                                             then RR = 2/8 = 0.25, and RRR = 0.75.
                Attributable  The difference in risk between   If risk of lung cancer in smokers is 21%   AR =    a   −  c
                 risk         exposed and unexposed groups.  and risk in nonsmokers is 1%, then the       a + b   c + d
                                                             attributable risk is 20%.                  RR − 1
                                                                                               AR% =        × 100
                                                                                                       RR
                Absolute    The difference in risk (not the   If 8% of people who receive a placebo   ARR =      c   −  a
                 risk         proportion) attributable to the   vaccine develop the flu vs 2% of people       c + d   a + b
                 reduction    intervention as compared to a   who receive a flu vaccine, then ARR =
                              control.                       8%–2% = 6% = 0.06.
                Number       Number of patients who need to                                    NNT = 1/ARR
                 needed to    be treated for 1 patient to benefit.
                 treat        Lower number = better treatment.
                Number       Number of patients who need to                                    NNH = 1/AR
                 needed to    be exposed to a risk factor for 1
                 harm         patient to be harmed. Higher
                              number = safer exposure.
                Case fatality  Percentage of deaths occurring   If 4 patients die among 10 cases of   CFR% =   deaths
                 rate         among those with disease.      meningitis, case fatality rate is 40%.      cases  × 100


          FAS1_2019_06-PubHealth.indd   258                                                                             11/7/19   4:16 PM
   297   298   299   300   301   302   303   304   305   306   307