
Page 306 - First Aid for the USMLE Step 1 2020, Thirtieth edition [MedicalBooksVN.com]_Neat
P. 306
262 SectiOn ii Public HealtH ScienceS ` PUBLIC HEALTH SCIENCES—EPIdEmIoLogy ANd BIoSTATISTICS Public HealtH ScienceS ` PUBLIC HEALTH SCIENCES—EPIdEmIoLogy ANd BIoSTATISTICS
Statistical distribution
Measures of central Mean = (sum of values)/(total number of values). Most affected by outliers (extreme values).
tendency Median = middle value of a list of data sorted If there is an even number of values, the median
from least to greatest. will be the average of the middle two values.
Mode = most common value. Least affected by outliers.
Measures of Standard deviation = how much variability σ = SD; n = sample size.
2
dispersion exists in a set of values, around the mean of Variance = (SD) .
these values. SE = σ/√n.
Standard error = an estimate of how much SE as n .
variability exists in a (theoretical) set of sample
means around the true population mean.
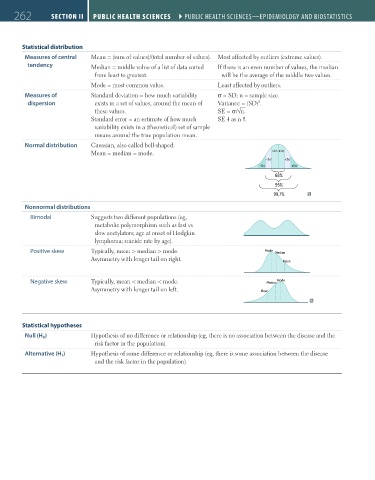
Normal distribution Gaussian, also called bell-shaped.
Mean = median = mode. –1σ +1σ
–2σ +2σ
–3σ +3σ
68%
95%
99.7%
–1σ +1σ
Nonnormal distributions –1σ +1σ
–2σ +2σ
Bimodal Suggests two different populations (eg, –3σ +3σ
–2σ +2σ
metabolic polymorphism such as fast vs –3σ +3σ
68%
slow acetylators; age at onset of Hodgkin 68%
95%
lymphoma; suicide rate by age). 95%
99.7%
Positive skew Typically, mean > median > mode. Mode 99.7%
Median
Asymmetry with longer tail on right. Mode Median
Mean
Mean
Mode
Median
Negative skew Typically, mean < median < mode. Median Mode
Mean
Asymmetry with longer tail on left. Mean
Statistical hypotheses
Null (H 0 ) Hypothesis of no difference or relationship (eg, there is no association between the disease and the
risk factor in the population).
Alternative (H 1 ) Hypothesis of some difference or relationship (eg, there is some association between the disease
and the risk factor in the population).
FAS1_2019_06-PubHealth.indd 262 11/7/19 4:16 PM