
Page 308 - First Aid for the USMLE Step 1 2020, Thirtieth edition [MedicalBooksVN.com]_Neat
P. 308
264 SectiOn ii Public HealtH ScienceS ` PUBLIC HEALTH SCIENCES—EPIdEmIoLogy ANd BIoSTATISTICS Public HealtH ScienceS ` PUBLIC HEALTH SCIENCES—ETHICS
Meta-analysis A method of statistical analysis that pools summary data (eg, means, RRs) from multiple studies
for a more precise estimate of the size of an effect. Also estimates heterogeneity of effect sizes
between studies.
Improves power, strength of evidence, and generalizability of study findings. Limited by quality of
individual studies and bias in study selection.
Common statistical tests
t-test Checks differences between means of 2 groups. Tea is meant for 2.
Example: comparing the mean blood pressure
between men and women.
ANOVA Checks differences between means of 3 or more 3 words: ANalysis Of VAriance.
groups. Example: comparing the mean blood pressure
between members of 3 different ethnic groups.
Chi-square (χ²) Checks differences between 2 or more Pronounce Chi-tegorical.
percentages or proportions of categorical Example: comparing the percentage of
outcomes (not mean values). members of 3 different ethnic groups who
have essential hypertension.
Fisher’s exact test Checks differences between 2 percentages or Example: comparing the percentage of 20 men
proportions of categorical, nominal outcomes. and 20 women with hypertension.
Use instead of chi-square test with small
populations.
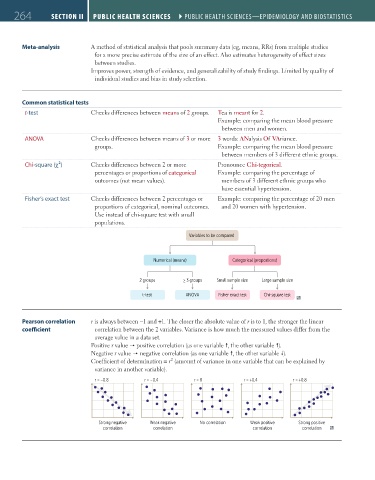
Variables to be compared
Numerical (means) Categorical (proportions)
2 groups ≥ 3 groups Small sample size Large sample size
t-test ANOVA Fisher exact test Chi-square test
Pearson correlation r is always between −1 and +1. The closer the absolute value of r is to 1, the stronger the linear
coefficient correlation between the 2 variables. Variance is how much the measured values differ from the
average value in a data set.
Positive r value positive correlation (as one variable , the other variable ).
Negative r value negative correlation (as one variable , the other variable ).
2
Coefficient of determination = r (amount of variance in one variable that can be explained by
variance in another variable).
r = –0.8 r = –0.4 r = 0 r = +0.4 r = +0.8
Strong negative Weak negative No correlation Weak positive Strong positive
correlation correlation correlation correlation
FAS1_2019_06-PubHealth.indd 264 11/7/19 4:16 PM