
Page 106 - APPLIED PROCESS DESIGN FOR CHEMICAL AND PETROCHEMICAL PLANTS, Volume 1, 3rd Edition
P. 106
90 Applied Process Design for Chemical and Petrochemical Plants
rounded values to no more than one decimal place are
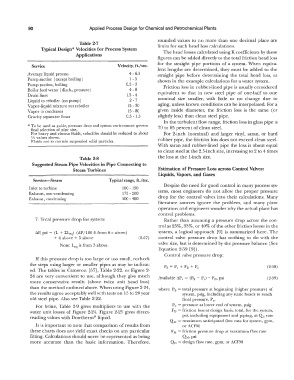
Table 2-7 limits for such head loss calculations.
Typical Design* Velocities for Process System The head losses calculated using K coefficients by these
Applications
figures can be added directly to the total friction head loss
for the straight pipe portions of a system. When equiva-
Service Velocity, ft./sec.
lent lengths are determined, they must be added to the
Average liquid process 4 - 6.5 straight pipe before determining the total head loss, as
Pump suction ( except boiling) 1 - 5 shown in the example calculations for a water system.
Pump suction, boiling 0.5 - 3
Boiler feed water ( disch., pressure) 4-8 Friction loss in rubber-lined pipe is usually considered
Drain lines 1.5 - 4 equivalent to that in new steel pipe of one-half to one
Liquid to re boiler ( no pump) 2-7 nominal size smaller, with little or no change due to
Vapor-liquid mixture out reboiler 15 - 30 aging, unless known conditions can be interpolated. For a
Vapor to condenser 15 - 80 given inside diameter, the friction loss is the same ( or
Gravity separator flows 0.5 - 1.5 slightly less) than clean steel pipe.
ln the turbulent flow range, friction loss in glass pipe is
*Tobe used as guide, pressure drop and system environment govern
final selection of pipe size. 70 to 85 percent of clean steel.
For heavy and viscous fluids, velocities should be reduced to about For 2-inch (nominal) and larger vinyl, saran, or hard
Y2 values shown.
Fluids not to contain suspended solid particles. rubber pipe, the friction loss does not exceed clean steel.
With saran and rubber-lined pipe the loss is about equal
to clean steel at the 2.5-inch size, increasing to 2 to 4 times
Table 2-8 the loss at the 1-inch size.
Suggested Steam Pipe Velocities in Pipe Connecting to
Steam Turbines Estimation of Pressure Loss across Control Valves:
Liquids, Vapors, and Gases
Service-Steam Typical range, h./sec.
Despite the need for good control in many process sys-
Inlet to turbine 100 - 150
Exhaust, non-condensing 175 - 200 tems, most engineers do not allow the proper pressure
Exhaust, condensing 500 - 400 drop for the control valves into their calculations. Many
literature sources ignore the problem, and many plant
operators and engineers wonder why the actual plant has
control problems.
7. Total pressure drop for system: Rather than assuming a pressure drop across the con-
trol as 25%, 33%, or 40% of the other friction losses in the
t.P, psi= (L + I:Leql (t.P/100 ft from 6 c above) system, a logical approach [9] is summarized here. The
+ 4 above + 5 above (2-57) control valve pressure drop has nothing to do with the
Note: L 0 q is from 3 above. valve size, but is determined by the pressure balance (See
Equation 2-59 [9]).
Control valve pressure drop:
If this pressure drop is too large or too small, recheck
the steps using larger or smaller pipes as may be indicat- (2-58)
ed. The tables in Cameron [57], Table 2-22, or Figure 2-
24 are very convenient to use, although they give much Available Af'c = (Ps - P cl - Fo, psi (2-59)
more conservative results (about twice unit head loss)
than the method outlined above. When using Figure 2-24, where Ps = total pressure at beginning (higher pressure) of
the results agree acceptably well with tests on 15 to 20 year system, psig, including any static heads to reach
old steel pipe. Also see Table 2-22. final pressure, P 0•
For brine, Table 2-9 gives multipliers to use with the Pe = pressure at lower end of system, psig
water unit losses of Figure 2-24. Figure 2-25 gives direct- F 0 = friction loss at design basis, total, for the system,
reading values with Dowtherm® liquid. psi, including equipment and piping, at Q 0 rate
Q� 1 = maximum anticipated flow rate for system, gpm,
It is important to note that comparison of results from orACFM
these charts does not yield exact checks on any particular F� 1 = friction pressure drop at maximum flow rate
fitting. Calculations should never be represented as being Q\1, psi
more accurate than the basic information. Therefore, Q 0 = design flow rate, gpm, or ACFM