Page 108 - APPLIED PROCESS DESIGN FOR CHEMICAL AND PETROCHEMICAL PLANTS, Volume 1, 3rd Edition
P. 108

92                       Applied Process Design for Chemical  and Petrochemical  Plants

                                                                         q   Q
                                                                                           p
                                                                   Index 2                  65                   l:iP, •
                                                                                                                  • 05
                                                                                                                  ,06
                                                                                                                  .08
                                                                                                                   .I

                                           Index  l                                                                .2
                                      !
                                       .05

                                       .04
                                       .03  i
                                         ...
                                         c                                                    ...
                                                                                                               ..
                                         0                                                                     0
                                                                                              ..
                                         u  ---.--�                                           ·;;;             0
                                                                                              c
                                       • 02  .._                                              c                Q.
                                                                                                               ..
                                          I                                                   =  ..            Q.
                                                                                                               e
                                         .......                                                               c
                                                                                              ·;;
                                                                                                               �
                                                                                                               �
                                       .015                                                   "'               ..
                                                                                                               �
                                                                                              I
                                                                                           45  <I.             ...
                                                                                                               .. -
                                                                                                               ...
                                                                                                                '·  ;;
                                       .OJ
                                                                                                               <J
                                                                                _.,        40
                                                                                O  Q.   .2
                                                                                �ii:
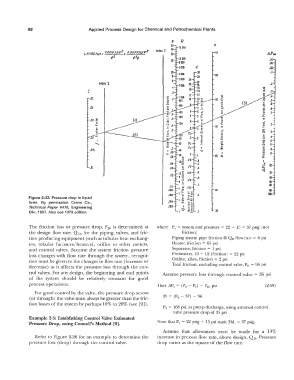
             Figure 2-23.  Pressure drop in  liquid                             ....
                                                                                vi�
             lines.  By  permission  Crane  Co.,                              I  -="'=i
             Technical  Paper #410,  Engineering                             0-   E�
             Div., 1957. Also see 1976 edition.                             I   ��   .I   l  37
             The  friction  loss  or  pressure  drop,  F0,  is  determined  at   where  Pc  =  system end pressure =  22  +  15 =  37 psig  (not
             the design  flow rate,  Q 0,  for the  piping, valves,  and fric-   friction)
             tion producing equipment (such as tubular heat exchang-     Piping system pipe friction @  Q0 flow rate  =  6 psi
             ers,  tubular  furnaces/heaters),  orifice  or  other  meters,   Heater,  friction =  65 psi
             and  control  valves.  Because  the  system  friction  pressure   Separator,  friction  =  1  psi
             loss  changes  with  flow  rate  through  the  system,  recogni-   Preheaters,  10 +  12  (friction)  =  22 psi
             tion must be given to the changes in flow rate  (increase or   Orifice, allow,  friction  =  2  psi
             decrease)  as  it affects  the pressure  loss  through  the con-   Total friction,  excluding control valve, F0  =  96 psi
             trol valves.  For any design,  the beginning and end points   Assume pressure loss  through control valve  =  35  psi
             of  the  system  should  be  relatively  constant  for  good
             process operations.                                                                                (2-59)
                For good control by the valve,  the pressure drop across
              (or through)  the valve must always be greater than the fric-   35  =  (Ps  - 37)  - 96
             tion losses of the system by perhaps  10%  to 20%  (see  [9]).
                                                                      Ps  =  168 psi,  at pump discharge,  using assumed control
                                                                          valve pressure drop of 35 psi
             Example 2-3:  Establishing Control Valve Estimated
             Pressure Drop, using Connell's Method [9].            Note that P,.  =  22 psig +  15 psi static Hd.  =  37 psig
                                                                     Assume  that  allowances  must  be  made  for  a  10%
                Refer Lo  Figure  2-26 for an  example  to  determine the   increase in  process  flow rate,  above  design, Q 0.  Pressure
             pressure loss  (drop)  through  the control valve.    drop varies as the square of the flow rate.
   103   104   105   106   107   108   109   110   111   112   113