
Page 107 - APPLIED PROCESS DESIGN FOR CHEMICAL AND PETROCHEMICAL PLANTS, Volume 1, 3rd Edition
P. 107
Fluid Flow 91
d
:!II .s
II" Q q
JOO
!0000 4IDlO .6
iDlO 80 V2
30000
!000 '° .7
200IIJ 40
«lOO l/4 .s
ll
mo .9
10000 lO
8000 1.0
1000
6000
p
1000 I', 37
800 LS
I'?
600 40
v
lOO
JOO
� llO 80 .... 0
60
0
0 .., M
� Cl v 45
"' 200 - Jl .., 2.5 ..c
�
0
u
.., :Ill c
u
c � � 15 O
0 im u v :... >
0.. .... u -------r=-10-'i---_:: ( 2
0 IOO � ---
.., 80 -=i2Do - s 6 - � ..
..
:
c
�
-
c
.,.·
"" ... Q) c - .3 .. - � �
0
u
c 40 �100 .2 ;;:: 0 55
� 0 80 0
..: JO u ..
.. co
u
.. 20 .I I
";; a: ""
u
"" .08 � 60
= 10 .06
.04
.I 65
.OJ
.02 1D 10
12
14
.006 IS IS
.004 IS
I
.003
.8 lO
2D
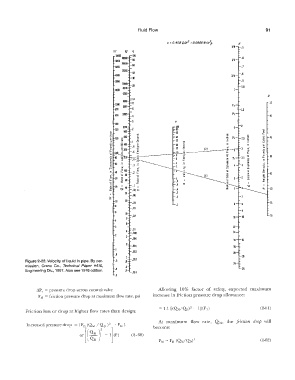
Figure 2-22. Velocity of liquid in pipe. By per- .6 .8 .002 24
mission, Crane Co., Technical Paper #410, .6
Engineering Div., 1957. Also see 1976 edition. ·.4 .5 .001 ·25
.3
L'i.P c = pressure drop across control valve Allowing 10% factor of safety, expected maximum
F�1 = friction pressure drop at maximum flow rate, psi increase in friction pressure drop allowance:
(2-61)
Friction Joss or drop at higher flow rates than design:
or r - l}F)
At maximum flow rate, Q:,.,i, the friction drop will
Increased pressu:;-e drop = [FD (QM /QD )2 - FD], become:
[
( :;:
(2-60)
(2-62)