Page 526 - APPLIED PROCESS DESIGN FOR CHEMICAL AND PETROCHEMICAL PLANTS, Volume 1, 3rd Edition
P. 526

492                       Applied  Process Design for Chemical  and Petrochemical  Plants


                                 •o.ooo""

                                 30.000

                                 10.000

                                                                                               .s
                                 19.ggg                                                     200  ..
                                                                                               •  �
                                  II,
                                                                                               '  ..
                                  8.000                                                        ..
                                  1,000                                                     100;
                                  6,000                                                        .
                                                                                               ..
                                  �000                                                      l!>  •  ..  •
                                  d/)00                                                        •
                                                                                               r
                                i  3,00!)                                                   ,0  e
                                :I                                                          :u
                                                                                            'l!>
                                ;                                                           ·�
                                ' 2.000
                                :
                                •
                                L
                                c..  ..                                                     �
                                ..
                                'S
                                0
                                A                                                           0
                                ,c
                                                                                            �
                                                                                            10
                                                                                            "
                                                                                               t
                                                                                            'lO   i
                                                                                               !
                                                                                               i
                                                                                               i
                                                                                               �
                                                                                            2!>  I


                                                        Ttmperolllf't  of liquid. O�C.
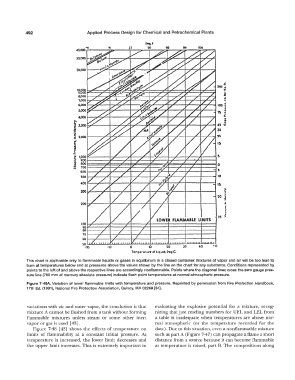
            This chart is applicable only to flammable liquids or gases in equilibrium in a closed container.  Mixtures of vapor and air will  be too lean to
            burn at temperatures below and at pressures above the values shown by the line on the chart for any substance. Conditions represented by
            points to the left of and above the respective lines are accordingly nonflammable.  Points where the diagonal lines cross the zero gauge pres-
            sure line (760 mm of mercury absolute pressure)  indicate flash point temperatures at normal  atmospheric pressure.
            Figure 7-49A.  Variation  of lower flammable limits with temperature and  pressure.  Reprinted  by permission  from Fire Protection Handbook,
            17th  Ed.  (1991 ), National Fire Protection Association,  Quincy,  MA 02269 [34].


            variations with  air and water vapor,  the conclusion  is that   evaluating  the  explosive  potential  for  a  mixture,  recog-
            mixture A cannot be flushed from a tank without forming   nizing that  just reading numbers for UEL and LEL from
            flammable  mixtures  unless  steam  or  some  other  inert   a  table  is  inadequate  when  temperatures  are  above  nor-
            vapor or gas is used  (43].                           mal  atmospheric  (or  the  temperature  recorded  for  the
               Figure  7-48  [ 43]  shows  the  effects  of temperature  on   date). Due to this situation, even a nonflammable mixture
            limits  of flammability  at  a  constant  initial  pressure.  As   such as part  A (Figure 7-47)  can propagate a flame a short
            temperature  is  increased,  the  lower limit decreases  and   distance from a source because it can become flammable
            the upper limit increases.  This is  extremely  important in   as  temperature  is raised,  part B.  The  compositions  along
   521   522   523   524   525   526   527   528   529   530   531