Page 530 - APPLIED PROCESS DESIGN FOR CHEMICAL AND PETROCHEMICAL PLANTS, Volume 1, 3rd Edition
P. 530

496                       Applied Process Design for Chemical and Petrochemical  Plants

               CONCENTRATION OF ETHYL ALCOHOL IN LIQUID PHASE, wt%          CONCENll\ATION OF WATER, llol %
              0    10   20   30   40   60   80   70   80  90  100          80   70   80   60   40   311   20   10
             70
                                                      9

             eo


                              c,1  (9.MII
                                                               �                                              �
                                                               ..;                                            ..;
                                                               a:                                         110  a:
                                                               �
                                                                                                              �
                                                  ..  -        �
                                                               )(                                             �
                                                               :i                                         IGO  :i
                                                               u.                                             u.
                                                               0                                              0
                                                               !z                                         IO   !z
                                                               �                                              �
                                                               !                                          IO   i
                     LfL  (JAi                                                                                u.
                                                                                                              �
                                                                                                          JO

             10
                                                      1


                                                      0
              0   10   20   30   40   60   80   70   BO   90   100         20   311   40   60   80   �   IO   80   lGO
               CONCENTRATION OF ETHYL ALCOHOL IN LIQUID PHASE, vol %     CONCENTRATION OF ETHYL ALCOHOL, VOi %
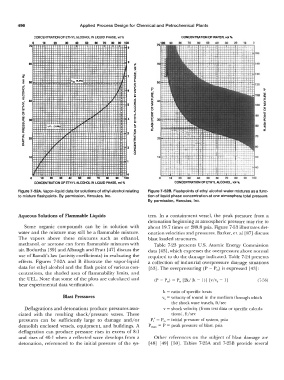
         Figure 7-52A. Vapor-liquid data for solutions of ethyl alcohol relating   Figure 7-528. Flashpoints of ethyl alcohol-water mixtures as a func-
         to mixture flashpoints.  By permission,  Hercules,  Inc.   tion of liquid phase concentration at one atmosphere total  pressure.
                                                              By permission,  Hercules,  Inc.


         Aqueous Solutions of Flammable Liquids               tern.  In  a  containment vessel,  the  peak  pressure  from  a
                                                              detonation beginning at atmospheric pressure may rise to
           Some  organic  compounds  can  be  in  solution  with   about 19.7 times or 289.8 psia.  Figure  7-53 illustrates det-
         water and the  mixture  may  still  be  a  flammable mixture.   onation velocities and pressures.  Barker,  et.  al  [87]  discuss
         The  vapors  above  these  mixtures  such  as  ethanol,   blast loaded structures.
         methanol,  or acetone can form flammable mixtures with   Table  7-23  presents  U.S.  Atomic  Energy  Commission
         air.  Bodurtha [39]  and Albaugh and Pratt [ 47]  discuss the   data [ 43], which expresses the overpressure above normal
         use of Raoult's law  (activity coefficients)  in evaluating the   required to do the damage indicated.  Table 7-24 presents
         effects.  Figures  7-52A  and  B  illustrate  the  vapor-liquid   a  collection of industrial  overpressure  damage  situations
         data for ethyl  alcohol  and  the flash  point of various con-   [53]. The overprcssuring  (P - P 0)   is  expressed  [43]:
         centrations,  the  shaded  area  of flammability  limits,  and
         the UEL.  Note  that some of the  plots are  calculated and   (P  -  P 0)  =  P [2k/(k - l)]  lv/v,  -  I]   (7-56)
                                                                           0
         bear experimental data verification.
                                                                    k  =  ratio of specific  heats
                           Blast Pressures                          v,  =  velocity of sound in the medium  through which
                                                                        the shock wave  travels,  ft/sec
           Deflagrations and detonations produce pressures asso-     v  =  shock velocity  (from  test data or specific  calcula-
         ciated  with  the  resulting  shock/pressure  waves.  These    tions), ft/  sec
         pressures  can  be  sufficiently  large  to  damage  and/or   P,' =  P O  =  initial pressure of system, psia
         demolish  enclosed  vessels,  equipment,  and  buildings.  A   P  max  =  P  =  peak pressure of blast,  psi a
         deflagration  can  produce  pressure  rises  in  excess  of 8:1
         and  rises  of 40:1  when  a  reflected wave  develops from  a   Other references  on  the  subject  of blast  damage  are
         detonation,  referenced  to  the  initial  pressure  of the  sys-   [ 48]  [ 49]  [50].  Tables  7-25A  and  7-258  provide  several
   525   526   527   528   529   530   531   532   533   534   535