
Page 537 - APPLIED PROCESS DESIGN FOR CHEMICAL AND PETROCHEMICAL PLANTS, Volume 1, 3rd Edition
P. 537
Applied Process Design 503
Blast Scaling When accounting for effective charge weight at ground
reflection the conversion is [ 49]:
The Universal Hopkinson-Cranz and Sachs Laws of
Blast Scaling have both been verified by experiment. (7-63)
These laws state that self-similar blast (shock) waves are
produced at identical scaled distances when two explosive We = effective charge weight in pounds of Tl\'T for estimating
charges of similar geometry and the same explosive com- surface burst effects with free air.
position, but of different size, are detonated in the same
atmosphere [ 49]. It is assumed that the energy reieased is proportional
to the mass of a specific explosive [ 40].
The scaled distance Z, which is a proportionately con-
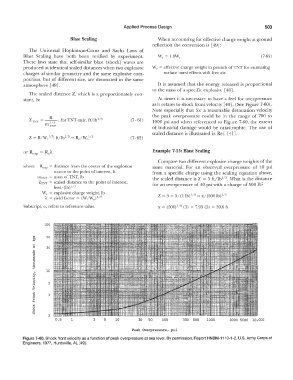
stant, is: At times it is necessary to have a feei for overpressure
as it relates to shock front velocity [ 49]. (See Figure 7-60).
Note especially that for a reasonable detonation velocity
the peak overpressure could be in the range of 700 to
Z 1.'11. =--R-, forTNToniy, fl/lb 113 (7 - 61) 1000 psi and when referenced to Figure 7-60, the extent
1/3
.
IT!Tl\"T
of industrial damage would be catastrophic. The use of
scaled distance is illustrated in Ref. [ 41].
(7-62)
or Rexp = RoA Example 7-15: Blast Scaling
Compare two different explosive charge weights of the
where R,xp = distance from the center of the explosion same material. For an observed overpressure of 40 psi
source to the point of interest, ft from a specific charge using the scaling equation above,
mTNT = mass of TNT, lb the scaled distance is Z = 5 ft/lb 1 What is the distance
1 3.
0NT = scaled distance to the point of interest, for an overpressure of 40 psi with a charge of 500 lb?
feet/ (lb) 113
We = explosive charge weight, lb 1 1
1 3
A = yield factor= (W/V1 10) 1 Z = 5 = 5/(l lb) 1 3 = x/(500 lb) 1 3
Subscript, o, refers to reference value. x = (500) i/s (5) = 7.93 (5) = 39.6 ft
100
"'
,fr 50
""' o 30
OJ
"' �
Ul
"
0
ii
10
5
3
�
o
0
.s::
,:/]
1
0.5 1 3 5 10 30 so 100 300 500 1000 3000 5000 10,000
Peak Overpressure, psi
Figure 7-60. Shock front velocity as a function of peak overpressure at sea level. By permission, Report HNDM-1110-1-2, U.S. Army Corps of
Engineers, 1977, Huntsville, AL (49].