Page 551 - APPLIED PROCESS DESIGN FOR CHEMICAL AND PETROCHEMICAL PLANTS, Volume 1, 3rd Edition
P. 551

Applied Process Design                                    517

                                             Vent  Release Pressure   Maximum  Pressure  During Venting


                                                                     P,ed �  0.2 bar ga  ---...               �
               �I\:                                                  P,ed = 0.4 bar ga  ---.,_ r-,         i,..,""
               '�  �                 �pstat=0.1  bar ga              P,ed = 0.6 bar ga  �  �  �       '',/  .... �  �
                I\:
                  �'               v                                 P,ed = 0.8 bar ga   ,  ,--..;;..  '  �I\   ,I  �  � �I,'  ,,..
                                                                                                            ...  ��
                                     i.,-- Pstat = 0 .2  bar ga
                                                                     P,ed =  1.0 bar ga  -  rs..
                    '�'\.       ,I  v  V,,  i,--  P,tat  = 0 .5 bar ga   P,ed =  1.5  bar ga  ------  �  �  i'\ "  ... � �,/�  � �  �v
                                                                                       i"\
                      '\.�   1/11   I/  ,I  v                        P,ed = 2.0 bar ga  �  r-  I'\  "   �  �  i.,,
                                 1,1'
                         '  �i,."'v                                                 "\ ' �     �
                                                                                         I(
                            �  �                                                         'rt'�   �.I7
                                                                                     /  ....
                                                                                       1
                              "�  �                                              /  h  �  �� )
                                '� �                                           VA  �   �:....
                                   �  '                                    ...  i.   �  �
                                      �'\.                             ..... � h�  V/
                                                                               ....
                                       �                           l/  �  �::::��
                                            �
                                          '  �l'I               �  �  �  � 1,.,1
                                            �  l'             �  � t-
                                              �,,
                                             l'I i'I '-            v
                                               l'I..   �      �
                                                 � �          �
                                                   � �
                                                      �                                                I
                                                       ""'

              !;0        10                              0.1                  10              100             1000
                          ------Vent Area, m   2                            Vessel  Volume, m 3----- �
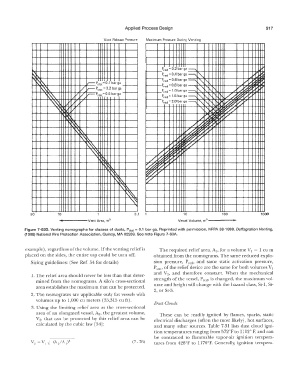
            Figure  7-650.  Venting  nomographs for classes of dusts,  Pstat =  0.1  bar ga.  Reprinted  with  permission,  NFPA 68-1988,  Deflagration  Venting,
            (1988)  National  Fire  Protection Association,  Quincy,  MA 02269.  See note Figure 7-63A.


            example), regardless of the volume.  If the venting relief is   The required relief area, A 1,  for a volume \1 1  =  1  cum
            placed on the sides,  the entire  top could be torn off.   obtained from the nomograms. The same reduced explo-
              Sizing guidelines:  (See Ref.  54 for details)      sion  pressure,  Pred,  and  same  static  activation  pressure,
                                                                  Ps,at•  of the relief device are the same for both volumes V 1
                                                                  and  V 2,  and  therefore  constant.  When  the  mechanical
              l. The relief area should never be less  than that deter-
                mined from  the nomograms.  A silo's cross-sectional   strength  of the vessel,  Pred•  is changed,  the maximum vol-
                                                                  ume and height will change with  the hazard class, St-1, St-
                area establishes the maximum that can be protected.
                                                                  2,  or St-3.
              2. The  nomograms  are  applicable only for vessels with
                volumes  up to  1,000 cu meters  (35,315 cu ft).
                                                                  Dust  Clouds
              3.  Using  the  limiting  relief area  as  the  cross-sectional
                area of an  elongated vessel, A 2,  the greatest volume,   These  can  be  readily  ignited  by  flames,  sparks,  static
                V2,  that  can  be  protected  by  this  relief area  can  be   electrical  discharges  ( often  the most likely), hot surfaces,
                calculated by  .. he cubic law  [54]:             and  many  other sources.  Table 7-31  lists  dust cloud  igni-
                                                                  tion temperatures ranging from 572°F to 1112° F,  and can
                                                                  be  contrasted  to  flammable  vapor-air  ignition  tempera-
                                                         (7- 76)   tures  from  428°F to  1170°F.  Generally,  ignition  tempera-
   546   547   548   549   550   551   552   553   554   555   556