
Page 102 - Python Data Science Handbook
P. 102
In[23]: np.random.seed(42)
x = np.random.randn(100)
# compute a histogram by hand
bins = np.linspace(-5, 5, 20)
counts = np.zeros_like(bins)
# find the appropriate bin for each x
i = np.searchsorted(bins, x)
# add 1 to each of these bins
np.add.at(counts, i, 1)
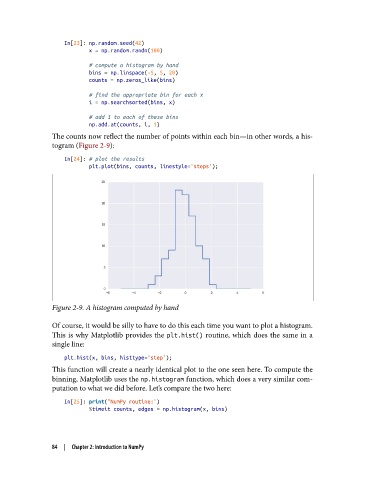
The counts now reflect the number of points within each bin—in other words, a his‐
togram (Figure 2-9):
In[24]: # plot the results
plt.plot(bins, counts, linestyle='steps');
Figure 2-9. A histogram computed by hand
Of course, it would be silly to have to do this each time you want to plot a histogram.
This is why Matplotlib provides the plt.hist() routine, which does the same in a
single line:
plt.hist(x, bins, histtype='step');
This function will create a nearly identical plot to the one seen here. To compute the
binning, Matplotlib uses the np.histogram function, which does a very similar com‐
putation to what we did before. Let’s compare the two here:
In[25]: print("NumPy routine:")
%timeit counts, edges = np.histogram(x, bins)
84 | Chapter 2: Introduction to NumPy