
Page 146 - Python Data Science Handbook
P. 146
Hierarchical Indexing
Up to this point we’ve been focused primarily on one-dimensional and two-
dimensional data, stored in Pandas Series and DataFrame objects, respectively. Often
it is useful to go beyond this and store higher-dimensional data—that is, data indexed
by more than one or two keys. While Pandas does provide Panel and Panel4D objects
that natively handle three-dimensional and four-dimensional data (see “Panel Data”
on page 141), a far more common pattern in practice is to make use of hierarchical
indexing (also known as multi-indexing) to incorporate multiple index levels within a
single index. In this way, higher-dimensional data can be compactly represented
within the familiar one-dimensional Series and two-dimensional DataFrame objects.
In this section, we’ll explore the direct creation of MultiIndex objects; considerations
around indexing, slicing, and computing statistics across multiply indexed data; and
useful routines for converting between simple and hierarchically indexed representa‐
tions of your data.
We begin with the standard imports:
In[1]: import pandas as pd
import numpy as np
A Multiply Indexed Series
Let’s start by considering how we might represent two-dimensional data within a
one-dimensional Series. For concreteness, we will consider a series of data where
each point has a character and numerical key.
The bad way
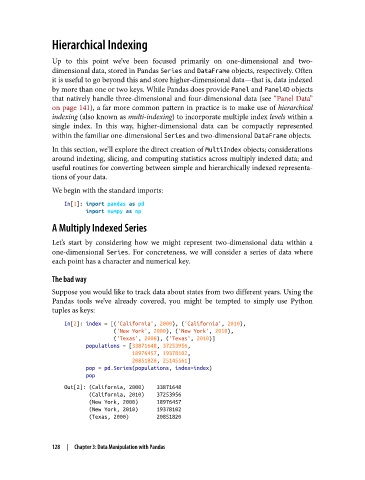
Suppose you would like to track data about states from two different years. Using the
Pandas tools we’ve already covered, you might be tempted to simply use Python
tuples as keys:
In[2]: index = [('California', 2000), ('California', 2010),
('New York', 2000), ('New York', 2010),
('Texas', 2000), ('Texas', 2010)]
populations = [33871648, 37253956,
18976457, 19378102,
20851820, 25145561]
pop = pd.Series(populations, index=index)
pop
Out[2]: (California, 2000) 33871648
(California, 2010) 37253956
(New York, 2000) 18976457
(New York, 2010) 19378102
(Texas, 2000) 20851820
128 | Chapter 3: Data Manipulation with Pandas