
Page 149 - Python Data Science Handbook
P. 149
two-dimensional data within a one-dimensional Series, we can also use it to repre‐
sent data of three or more dimensions in a Series or DataFrame. Each extra level in a
multi-index represents an extra dimension of data; taking advantage of this property
gives us much more flexibility in the types of data we can represent. Concretely, we
might want to add another column of demographic data for each state at each year
(say, population under 18); with a MultiIndex this is as easy as adding another col‐
umn to the DataFrame:
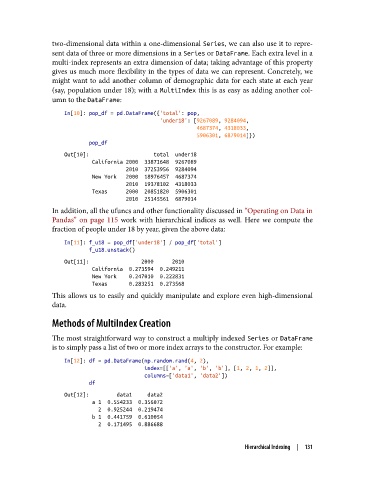
In[10]: pop_df = pd.DataFrame({'total': pop,
'under18': [9267089, 9284094,
4687374, 4318033,
5906301, 6879014]})
pop_df
Out[10]: total under18
California 2000 33871648 9267089
2010 37253956 9284094
New York 2000 18976457 4687374
2010 19378102 4318033
Texas 2000 20851820 5906301
2010 25145561 6879014
In addition, all the ufuncs and other functionality discussed in “Operating on Data in
Pandas” on page 115 work with hierarchical indices as well. Here we compute the
fraction of people under 18 by year, given the above data:
In[11]: f_u18 = pop_df['under18'] / pop_df['total']
f_u18.unstack()
Out[11]: 2000 2010
California 0.273594 0.249211
New York 0.247010 0.222831
Texas 0.283251 0.273568
This allows us to easily and quickly manipulate and explore even high-dimensional
data.
Methods of MultiIndex Creation
The most straightforward way to construct a multiply indexed Series or DataFrame
is to simply pass a list of two or more index arrays to the constructor. For example:
In[12]: df = pd.DataFrame(np.random.rand(4, 2),
index=[['a', 'a', 'b', 'b'], [1, 2, 1, 2]],
columns=['data1', 'data2'])
df
Out[12]: data1 data2
a 1 0.554233 0.356072
2 0.925244 0.219474
b 1 0.441759 0.610054
2 0.171495 0.886688
Hierarchical Indexing | 131