
Page 238 - Python Data Science Handbook
P. 238
Plotting from an IPython notebook
The IPython notebook is a browser-based interactive data analysis tool that can com‐
bine narrative, code, graphics, HTML elements, and much more into a single exe‐
cutable document (see Chapter 1).
Plotting interactively within an IPython notebook can be done with the %matplotlib
command, and works in a similar way to the IPython shell. In the IPython notebook,
you also have the option of embedding graphics directly in the notebook, with two
possible options:
• %matplotlib notebook will lead to interactive plots embedded within the
notebook
• %matplotlib inline will lead to static images of your plot embedded in the
notebook
For this book, we will generally opt for %matplotlib inline:
In[3]: %matplotlib inline
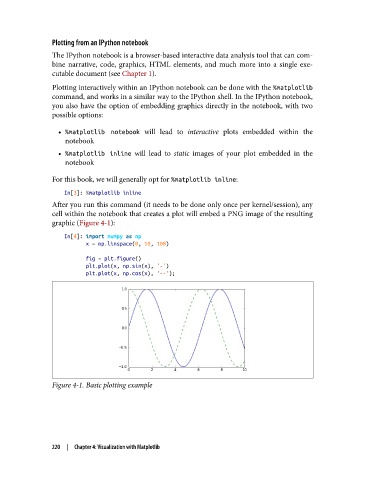
After you run this command (it needs to be done only once per kernel/session), any
cell within the notebook that creates a plot will embed a PNG image of the resulting
graphic (Figure 4-1):
In[4]: import numpy as np
x = np.linspace(0, 10, 100)
fig = plt.figure()
plt.plot(x, np.sin(x), '-')
plt.plot(x, np.cos(x), '--');
Figure 4-1. Basic plotting example
220 | Chapter 4: Visualization with Matplotlib