
Page 240 - Python Data Science Handbook
P. 240
'svg': 'Scalable Vector Graphics',
'svgz': 'Scalable Vector Graphics',
'tif': 'Tagged Image File Format',
'tiff': 'Tagged Image File Format'}
Note that when saving your figure, it’s not necessary to use plt.show() or related
commands discussed earlier.
Two Interfaces for the Price of One
A potentially confusing feature of Matplotlib is its dual interfaces: a convenient
MATLAB-style state-based interface, and a more powerful object-oriented interface.
We’ll quickly highlight the differences between the two here.
MATLAB-style interface
Matplotlib was originally written as a Python alternative for MATLAB users, and
much of its syntax reflects that fact. The MATLAB-style tools are contained in the
pyplot (plt) interface. For example, the following code will probably look quite
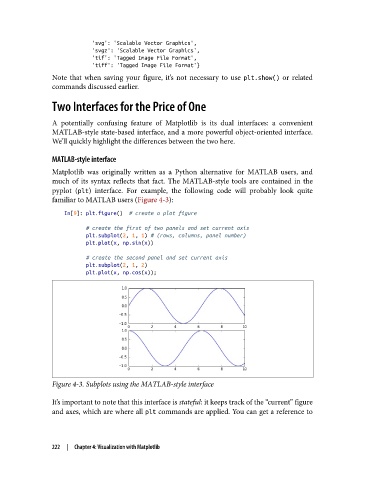
familiar to MATLAB users (Figure 4-3):
In[9]: plt.figure() # create a plot figure
# create the first of two panels and set current axis
plt.subplot(2, 1, 1) # (rows, columns, panel number)
plt.plot(x, np.sin(x))
# create the second panel and set current axis
plt.subplot(2, 1, 2)
plt.plot(x, np.cos(x));
Figure 4-3. Subplots using the MATLAB-style interface
It’s important to note that this interface is stateful: it keeps track of the “current” figure
and axes, which are where all plt commands are applied. You can get a reference to
222 | Chapter 4: Visualization with Matplotlib