
Page 241 - Python Data Science Handbook
P. 241
these using the plt.gcf() (get current figure) and plt.gca() (get current axes)
routines.
While this stateful interface is fast and convenient for simple plots, it is easy to run
into problems. For example, once the second panel is created, how can we go back
and add something to the first? This is possible within the MATLAB-style interface,
but a bit clunky. Fortunately, there is a better way.
Object-oriented interface
The object-oriented interface is available for these more complicated situations, and
for when you want more control over your figure. Rather than depending on some
notion of an “active” figure or axes, in the object-oriented interface the plotting func‐
tions are methods of explicit Figure and Axes objects. To re-create the previous plot
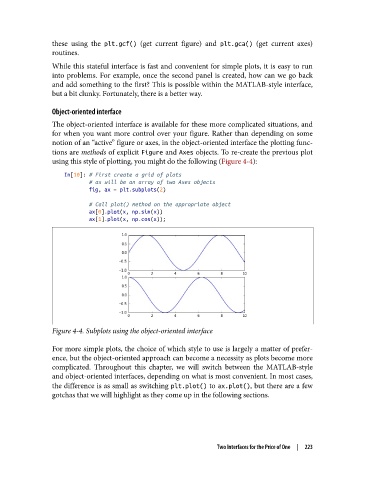
using this style of plotting, you might do the following (Figure 4-4):
In[10]: # First create a grid of plots
# ax will be an array of two Axes objects
fig, ax = plt.subplots(2)
# Call plot() method on the appropriate object
ax[0].plot(x, np.sin(x))
ax[1].plot(x, np.cos(x));
Figure 4-4. Subplots using the object-oriented interface
For more simple plots, the choice of which style to use is largely a matter of prefer‐
ence, but the object-oriented approach can become a necessity as plots become more
complicated. Throughout this chapter, we will switch between the MATLAB-style
and object-oriented interfaces, depending on what is most convenient. In most cases,
the difference is as small as switching plt.plot() to ax.plot(), but there are a few
gotchas that we will highlight as they come up in the following sections.
Two Interfaces for the Price of One | 223