
Page 243 - Python Data Science Handbook
P. 243
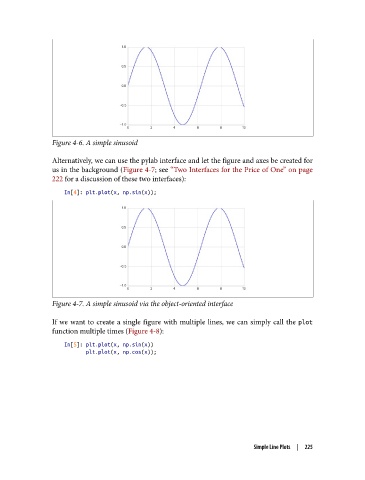
Figure 4-6. A simple sinusoid

               Alternatively, we can use the pylab interface and let the figure and axes be created for
               us in the background (Figure 4-7; see “Two Interfaces for the Price of One” on page
               222 for a discussion of these two interfaces):
                   In[4]: plt.plot(x, np.sin(x));


               Figure 4-7. A simple sinusoid via the object-oriented interface


               If we want to create a single figure with multiple lines, we can simply call the plot
               function multiple times (Figure 4-8):

                   In[5]: plt.plot(x, np.sin(x))
                          plt.plot(x, np.cos(x));


                                                                       Simple Line Plots  |  225