
Page 82 - Towards_a_New_Malaysia_The_2018_Election_and_Its_6146371_(z-lib.org)
P. 82
Cross-ethnic Vote-pooling in West Malaysia 67
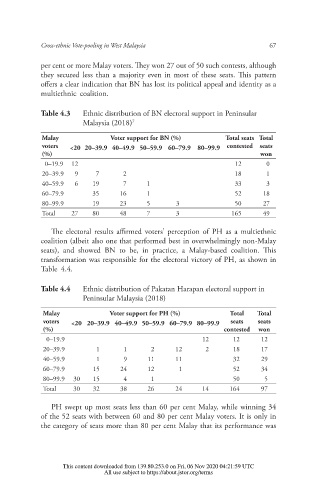
per cent or more Malay voters. ey won 27 out of 50 such contests, although
they secured less than a majority even in most of these seats. is pattern
o ers a clear indication that BN has lost its political appeal and identity as a
multiethnic coalition.
Table 4.3 Ethnic distribution of BN electoral support in Peninsular
Malaysia (2018) 7
Malay Voter support for BN (%) Total seats Total
voters <20 20–39.9 40–49.9 50–59.9 60–79.9 80–99.9 contested seats
(%) won
0–19.9 12 12 0
20–39.9 9 7 2 18 1
40–59.9 6 19 7 1 33 3
60–79.9 35 16 1 52 18
80–99.9 19 23 5 3 50 27
Total 27 80 48 7 3 165 49
e electoral results a rmed voters’ perception of PH as a multiethnic
coalition (albeit also one that performed best in overwhelmingly non-Malay
seats), and showed BN to be, in practice, a Malay-based coalition. is
transformation was responsible for the electoral victory of PH, as shown in
Table 4.4.
Table 4.4 Ethnic distribution of Pakatan Harapan electoral support in
Peninsular Malaysia (2018)
Malay Voter support for PH (%) Total Total
voters <20 20–39.9 40–49.9 50–59.9 60–79.9 80–99.9 seats seats
(%) contested won
0–19.9 12 12 12
20–39.9 1 1 2 12 2 18 17
40–59.9 1 9 11 11 32 29
60–79.9 15 24 12 1 52 34
80–99.9 30 15 4 1 50 5
Total 30 32 38 26 24 14 164 97
PH swept up most seats less than 60 per cent Malay, while winning 34
of the 52 seats with between 60 and 80 per cent Malay voters. It is only in
the category of seats more than 80 per cent Malay that its performance was
This content downloaded from 139.80.253.0 on Fri, 06 Nov 2020 04:21:59 UTC
All use subject to https://about.jstor.org/terms