
Page 85 - Towards_a_New_Malaysia_The_2018_Election_and_Its_6146371_(z-lib.org)
P. 85
70 Helen Ting Mu Hung
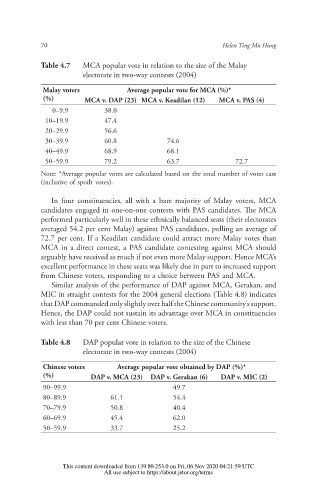
Table 4.7 MCA popular vote in relation to the size of the Malay
electorate in two-way contests (2004)
Malay voters Average popular vote for MCA (%)*
(%) MCA v. DAP (23) MCA v. Keadilan (12) MCA v. PAS (4)
0–9.9 38.0
10–19.9 47.4
20–29.9 56.6
30–39.9 60.8 74.6
40–49.9 68.9 68.1
50–59.9 79.2 63.7 72.7
Note: *Average popular votes are calculated based on the total number of votes cast
(inclusive of spoilt votes).
In four constituencies, all with a bare majority of Malay voters, MCA
candidates engaged in one-on-one contests with PAS candidates. e MCA
performed particularly well in these ethnically balanced seats (their electorates
averaged 54.2 per cent Malay) against PAS candidates, polling an average of
72.7 per cent. If a Keadilan candidate could attract more Malay votes than
MCA in a direct contest, a PAS candidate contesting against MCA should
arguably have received as much if not even more Malay support. Hence MCA’s
excellent performance in these seats was likely due in part to increased support
from Chinese voters, responding to a choice between PAS and MCA.
Similar analysis of the performance of DAP against MCA, Gerakan, and
MIC in straight contests for the 2004 general elections (Table 4.8) indicates
that DAP commanded only slightly over half the Chinese community’s support.
Hence, the DAP could not sustain its advantage over MCA in constituencies
with less than 70 per cent Chinese voters.
Table 4.8 DAP popular vote in relation to the size of the Chinese
electorate in two-way contests (2004)
Chinese voters Average popular vote obtained by DAP (%)*
(%) DAP v. MCA (23) DAP v. Gerakan (6) DAP v. MIC (2)
90–99.9 49.7
80–89.9 61.1 54.4
70–79.9 50.8 40.4
60–69.9 45.4 62.0
50–59.9 33.7 25.2
This content downloaded from 139.80.253.0 on Fri, 06 Nov 2020 04:21:59 UTC
All use subject to https://about.jstor.org/terms