
Page 83 - Towards_a_New_Malaysia_The_2018_Election_and_Its_6146371_(z-lib.org)
P. 83
68 Helen Ting Mu Hung
lacklustre. is pattern of performance, in e ect, mirrors the BN’s electoral
performance in 1999: strong results within the middle range, seats with less
than 80 per cent of voters of a single ethnicity (cf. Table 4.2). Nonetheless, in
order to examine the extent to which PH’s component parties (in this case,
speci cally DAP) bene tted from cross-ethnic vote-pooling, it is necessary to
examine the ethnic distribution of the popular vote for MCA and DAP.
e following section will examine the extent of the shift in cross-ethnic
vote-pooling in contests involving the two strongest Chinese-based parties,
MCA and DAP. e analysis compares the parties’ performance in the 2004
general elections, when MCA was at its peak, and the 2018 general elections,
when MCA was wiped out except for one narrowly won seat.
Cross-ethnic Vote-pooling for MCA and DAP: 2004 and
2018 Compared
2004 General Election
e 2004 general election saw MCA’s political fortune reaching new heights.
e party won 31 out of the 40 parliamentary seats and 75 out of the 90 state
8
seats it contested (Abdul Rashid and Tunku Mohar 2006: 330).
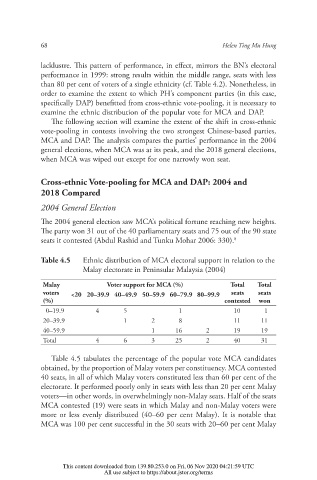
Table 4.5 Ethnic distribution of MCA electoral support in relation to the
Malay electorate in Peninsular Malaysia (2004)
Malay Voter support for MCA (%) Total Total
voters <20 20–39.9 40–49.9 50–59.9 60–79.9 80–99.9 seats seats
(%) contested won
0–19.9 4 5 1 10 1
20–39.9 1 2 8 11 11
40–59.9 1 16 2 19 19
Total 4 6 3 25 2 40 31
Table 4.5 tabulates the percentage of the popular vote MCA candidates
obtained, by the proportion of Malay voters per constituency. MCA contested
40 seats, in all of which Malay voters constituted less than 60 per cent of the
electorate. It performed poorly only in seats with less than 20 per cent Malay
voters—in other words, in overwhelmingly non-Malay seats. Half of the seats
MCA contested (19) were seats in which Malay and non-Malay voters were
more or less evenly distributed (40–60 per cent Malay). It is notable that
MCA was 100 per cent successful in the 30 seats with 20–60 per cent Malay
This content downloaded from 139.80.253.0 on Fri, 06 Nov 2020 04:21:59 UTC
All use subject to https://about.jstor.org/terms