Page 407 - Math Smart - 7
P. 407

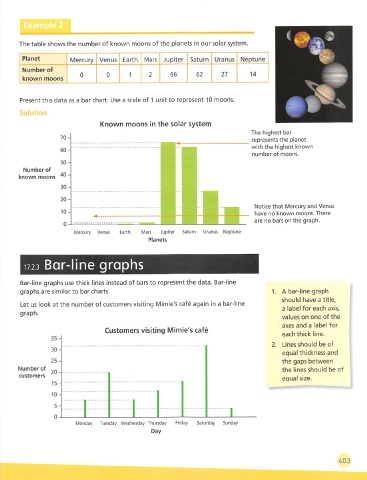
The table shows the number of known moons of the planets in our solar system.


        Planet          Mercury  Venus   Earth  Mars Jupiter   Saturn  Uranus  Neptune
        Number of
                           0       0       1     2      66      62       27       14
        known moons


       Present this data as a bar chart. Use a scale of 1 unit to represent 10 moons.

       Solution
                                 Known moons in the solar system
                                                                                  The highest bar
                    70-                                                            represents the planet
                                                                                   with the highest known
                    60-
                                                                                   number of moons.
                    50-
         Number of
       known moons     ~
                    30-
                    20-
                                                                                    Notice that Mercury and Venus
                     10-
                                                                                    have no known moons. There
                                                                                   are no bars on the graph.
                     0
                         Mercury  Venus   Earth   Mars   Jupiter   Saturn   Uranus  Neptune
                                                 Planets


               Bar-line graphs


       Bar-line graphs use thick lines instead of bars to represent the data. Bar-line
       graphs are similar to bar charts.                                                 1.  A bar-line graph
                                                                                            should have a title,
        Let us look at the number of customers visiting Mimie's cafe again in a bar-line
                                                                                            a label for each axis,
       graph.
                                                                                            values on one of the
                                                                                            axes and a label for
                                   Customers visiting Mimie's cafe
                                                                                            each thick line.
                    -
                                                                                         2.  Lines should be of
                                                                                            equal thickness and
                                                                                            the gaps between
       Number of                                                                            the lines should be of
       customers
                                                                                            equal size.

                    -
                    -         r
                           [                1                              I
                          Monday  Tuesday  Wednesday Thursday  Friday   Saturday   Sunday
                                                  Day


                                                                                                               403
   402   403   404   405   406   407   408   409   410   411   412