
Page 405 - Math Smart - 7
P. 405
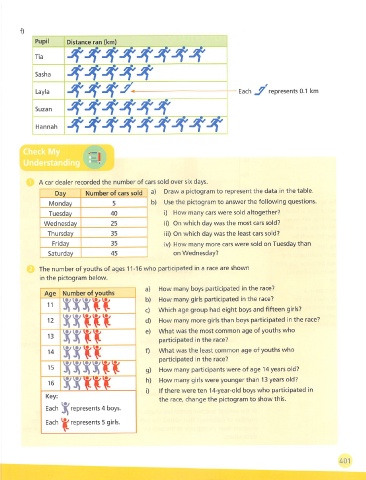
f)
            Pupil      Distance ran (km)
                                  Jf
            Tia


            Sasha

             Layla                                                             Each ^ represents 0.1 km


            Suzan


             Hannah


              A car dealer recorded the number of cars sold over six days.
                                                      Draw a pictogram to represent the data in the table.
                   Day       Number of cars sold
                 Monday              5            b) Use the pictogram to answer the following questions.
                 Tuesday             40               i)  How many cars were sold altogether?
               Wednesday             25               ii)  On which day was the most cars sold?
                Thursday             35               ili) On which day was the least cars sold?
                  Friday             35               iv) How many more cars were sold on Tuesday than
                 Saturday            45                  on Wednesday?

              The number of youths of ages 11-16 who participated in a race are shown
              in the pictogram below.
                                                a)  How many boys participated in the race?
               Age Number of youths
                                                b)  How many girls participated in the race?
                11
                                                c)  Which age group had eight boys and fifteen girls?
                     mtt
                12                              d)  How many more girls than boys participated in the race?
                                                e)  What was the most common age of youths who
                     un                              participated in the race?
                13
                     un
                14                              f)  What was the least common age of youths who
                                                     participated in the race?
                15                              g)  How many participants were of age 14 years old?

                                                h)  How many girls were younger than 13 years old?
                16
                                                i)   If there were ten 14-year-old boys who participated in
                Key:
                                                    the race, change the pictogram to show this.
                Each^ represents 4 boys.

                Each    represents 5 girls.


                                                                                                               A01