
Page 406 - Math Smart - 7
P. 406
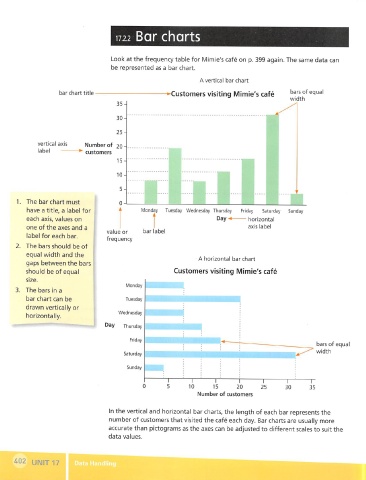
17.2.2  Bar charts


                                     Look at the frequency table for Mimie's cafe on p. 399 again. The same data can
                                     be represented as a bar chart.

                                                                  A vertical bar chart

                    bar chart title                     -Customers visiting Mimie's cafe
                                                                           ^                    width
                                       35-

                                       30-

                                       25 n
             vertical axis   Number of 20-
             label           customers
                                       15^

                                       10-

                                        5-

         The bar chart must
          have a title, a label for            Monday  Tuesday  Wednesday Thursday  Friday   Saturday  Sunday
          each axis, values on                                         Day •«-  — horizontal
         one of the axes and a                                                    axis label
                                    value or   bar label
         label for each bar.
                                    frequency
         The bars should be of
         equal width and the
                                                                 A horizontal bar chart
         gaps between the bars
         should be of equal                              Customers visiting Mimie's cafe
         size.
                                          Monday
         The bars in a
         bar chart can be                 Tuesday
         drawn vertically or
                                        Wednesday
         horizontally.
                                         Thursday

                                                                                                        bars of equal
                                                                                                        width
                                         Saturday
                                          Sunday

                                                                      T
                                                                               T
                                                              10      15      20
                                                                 Number of customers

                                    In the vertical and horizontal bar charts, the length of each bar represents the
                                    number of customers that visited the cafe each day. Bar charts are usually more
                                    accurate than pictograms as the axes can be adjusted to different scales to suit the
                                    data values.


     ^02 UNITTtIB
                         Data Ha
                                I