
Page 410 - Math Smart - 7
P. 410
17.2.4 Frequency diagrams for
grouped discrete data
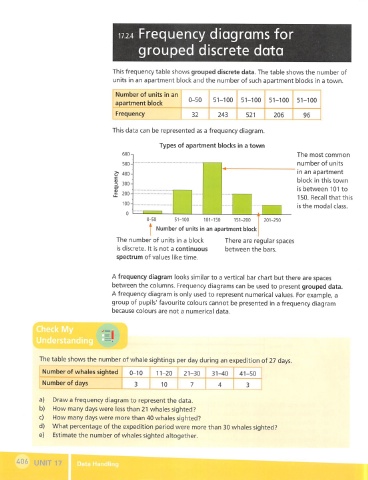
This frequency table shows grouped discrete data. The table shows the number of
units in an apartment block and the number of such apartment blocks in a town.
Number of units In an
0-50 51-100 51-100 51-100 51-100
apartment block
Frequency 32 243 521 206 96
This data can be represented as a frequency diagram.
Types of apartment blocks In a town
The most common
number of units
in an apartment
block in this town
is between 101 to
i 200-
150. Recall that this
is the modal class.
0-50 51-100 101-150 151-200 201-250
I Number of units in an apartment block
The number of units in a block There are regular spaces
is discrete. It is not a continuous between the bars.
spectrum of values like time.
A frequency diagram looks similar to a vertical bar chart but there are spaces
between the columns. Frequency diagrams can be used to present grouped data.
A frequency diagram is only used to represent numerical values. For example, a
group of pupils' favourite colours cannot be presented in a frequency diagram
because colours are not a numerical data.
Check My
Unde
The table shows the number of whale sightings per day during an expedition of 27 days.
Number of whales sighted 0-10 11-20 21-30 31-40 41-50
Number of days 3 10 7 4 3
a) Draw a frequency diagram to represent the data.
b) How many days were less than 21 whales sighted?
c) How many days were more than 40 whales sighted?
d) What percentage of the expedition period were more than 30 whales sighted?
e) Estimate the number of whales sighted altogether.
406 UNIT 17