Page 419 - Math Smart - 7
P. 419

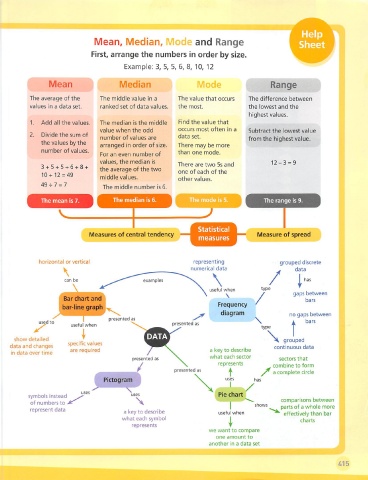
Mean, Median, Mode and Range

                              First arrange the numbers in order by size.
                                         Example: 3, 5, 5, 6, 8, 10, 12


                 Mean                   Median                    \/'k                  Range

          The average of the     The middle value In a     The value that occurs  The difference between
           values in a data set.  ranked set of data values.  the most.          the lowest and the
                                                                                 highest values.
           1.  Add all the values.  The median is the middle  Find the value that
                                 value when the odd        occurs most often in a  Subtract the lowest value
          2.  Divide the sum of                            data set.
                                 number of values are                            from the highest value.
              the values by the
                                 arranged in order of size.  There may be more
              number of values.                           than one mode.
                                 For an even number of
                                 values, the median is                                  12-3 = 9
                                                          There are two 5s and
              3+5+5+6+8+         the average of the two
                                                          one of each of the
              10+12 = 49
                                 middle values.
                                                           other values.
              49 + 7 = 7
                                  The middle number is 6.
              The mean is 7.         The median is 6.         The mode Is 5.          The range is 9.
                    V,                                            -2

                                                                 Statistical
                              Measures of central tendency  —^                      Measure of spread
                                                                 measures


              horizontal or vertical                           representing                grouped discrete
                                                               numerical data                   data
                                                                                       .
                                                                                       / i
                      can be                   examples                                            has
                                                                     useful when     type
                                                                                                gaps between
                                                                         \
                       ar chart and                                                /                bars
                     bar-line graph                                    Frequency
                                                                        diagram                no gaps between
                                    presented as
                 to                                      presented as              \                bars
                        useful when
                                                                                     type      t
                           I
     show detailed                                                                    \grouped
                       specific values
    data and changes                                                                      continuous data
                        are required                                 a key to describe
    in data over time
                                            presented                what each sector      sectors that
                                                                       represents
                                                                                         combine to form
                                                         presented as                ^ complete circle
                                                                                         a
                                                                           f
                                                                          uses     has
                                                                           I
          symbols instead                                              Pie chart
                                                                                            comparisons between
           of numbers to
                                                                                   shows    parts of a whole more
           represent data
                                         a key to describe              useful when          effectively than bar
                                        what each symbol                                          charts
                                            represents                     I
                                                                     we want to compare
                                                                       one amount to
                                                                    another in a data set
                                                                                                              415
 mK \r.
   414   415   416   417   418   419   420   421   422   423   424