
Page 417 - Math Smart - 7
P. 417
b) What percentage of the pupils scored 80 marks or more for the test?
c) What percentage of the pupils scored less than 50 marks for the test?
d) Complete the sentence.
More pupils had a test score in the interval than in any other interval.
The number of points scored by the eight winning teams in 17 matches are shown below.
94, 156, 154, 131, 129, 134, 152, 140, 124, 162, 103, 139, 82, 170, 110, 111, 116
a) Construct a frequency table for this data set using a class interval of size 10 starting at 80 points.
b) What is the modal class?
c) How many matches were won with a winning score of 99 points or less?
d) What percentage of the matches had winning scores of 150 points or more?
e) Use the modal class, median and range to describe the distribution of the data.
o A swimming pool has a mean water depth of 130 cm. A boy is 145 cm tall.
Can he stand safely in the pool?
o Explain why you would use the mode, median or mean as the average in each data set.
a) Test results of a group of pupils; AAAABBBCBAAAA
b) Wages of 10 office workers: $ 150, $ 180, $ 170, $ 160, $ 190, $ 165, $ 177
c) The average number of days in a month.
0 The table shows the salaries of the employees in a company.
Employee Annual salary ($)
Technician 27 000
Administrator 1 21 000
Administrator 2 23 000
Finance clerk 28 000
Enaineer 30 000
CEO secretarv 25 000
CEO 89 000
a) Calculate the mean salary of the employees.
b) Calculate the median salary of the employees.
c) Which measure gives more meaningful information about the salary of a employee of this
company? Explain.
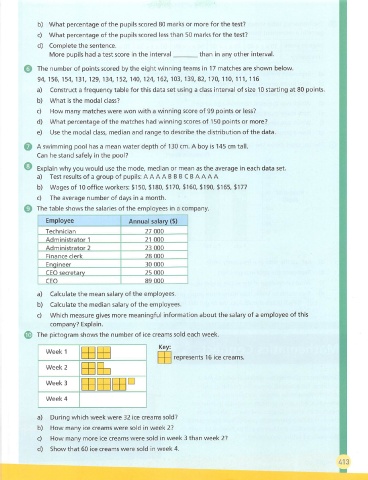
® The pictogram shows the number of ice creams sold each week.
Key:
Week 1
represents 16 ice creams.
Week 2
Week 3
Week 4
a) During which week were 32 ice creams sold?
b) How many ice creams were sold in week 2?
c) How many more ice creams were sold in week 3 than week 2?
d) Show that 60 ice creams were sold in week 4.
413