
Page 415 - Math Smart - 7
P. 415
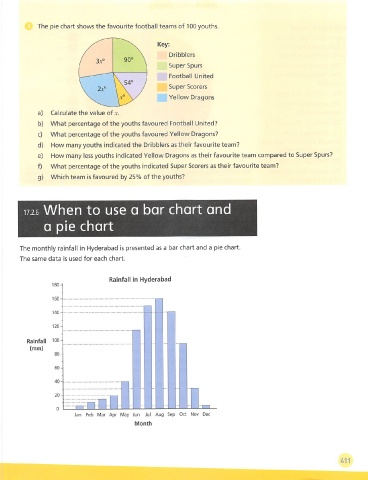
The pie chart shows the favourite football teams of 100 youths.


                                                    Key:
                                                        Dribblers
                                                        Super Spurs
                                                        Football United
                                                        Super Scorers
                                                        Yellow Dragons

             a)  Calculate the value of X.
             b)  What percentage of the youths favoured Football United?

             c)  What percentage of the youths favoured Yellow Dragons?
             d)  How many youths indicated the Dribblers as their favourite team?
             e)  How many less youths indicated Yellow Dragons as their favourite team compared to Super Spurs?
             f)  What percentage of the youths indicated Super Scorers as their favourite team?
             g)  Which team is favoured by 25% of the youths?


         17.2.6  When to use a bar chart and

               a pie chart


       The monthly rainfall in Hyderabad is presented as a bar chart and a pie chart.
       The same data is used for each chart.


                                    Rainfall in Hyderabad


          Rainfall  lOO-
          (mm)


                         Jan  Feb  Mar  Apr  May Jun  Jul  Aug Sep  Oct  Nov  Dec
                                             Month


                                                                                                               All