
Page 414 - Math Smart - 7
P. 414
Solution
Brown eyes are the most common. We can see that the sector in the pie chart
representing brown eyes has the largest angle {130°), indicating that the
number of pupils with brown eyes is the greatest.
Blue eyes are the least common. This sector is the smallest with the smallest
angle, 40°.
jq of the pupils have blue eyes. We can also say that 11.1% of the pupils have
blue eyes.
Method 1
We could use the angle size of the sector for pupils with blue eyes to calculate
the percentage.
^ X 100 = 11.1%
Method 2
We could use the number of pupils with blue eyes to calculate the
percentage.
^ X 100 =11.1%
Check your answer by We can use the angle sector size for green eyes to calculate the number of
comparing it with the pupils with green eyes.
data in the frequency ^X36 = 7
table.
7 pupils had green eyes.
I
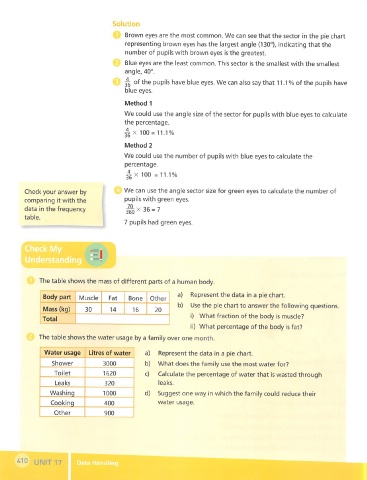
The table shows the mass of different parts of a human body.
a) Represent the data in a pie chart.
Body part Muscle Fat Bone Other
b) Use the pie chart to answer the following questions.
Mass (kg) 30 14 16 20
i) What fraction of the body Is muscle?
Total
ii) What percentage of the body is fat?
The table shows the water usage by a family over one month.
Water usage Litres of water a) Represent the data in a pie chart.
Shower 3000 b) What does the family use the most water for?
Toilet 1620 c) Calculate the percentage of water that is wasted through
Leaks 320 leaks.
Washing 1000 d) Suggest one way in which the family could reduce their
Cooking 400 water usage.
Other 900
410 UNIT 17i Data Handling'