
Page 44 - Computing Book 5
P. 44
Presenting Your Ideas Class 5
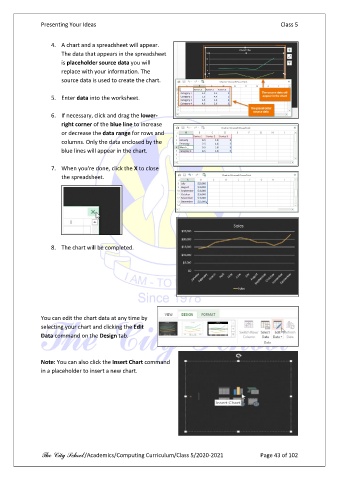
4. A chart and a spreadsheet will appear.
The data that appears in the spreadsheet
is placeholder source data you will
replace with your information. The
source data is used to create the chart.
5. Enter data into the worksheet.
6. If necessary, click and drag the lower-
right corner of the blue line to increase
or decrease the data range for rows and
columns. Only the data enclosed by the
blue lines will appear in the chart.
7. When you're done, click the X to close
the spreadsheet.
8. The chart will be completed.
You can edit the chart data at any time by
selecting your chart and clicking the Edit
Data command on the Design tab.
Note: You can also click the Insert Chart command
in a placeholder to insert a new chart.
The City School /Academics/Computing Curriculum/Class 5/2020-2021 Page 43 of 102