
Page 375 - Hall et al (2015) Principles of Critical Care-McGraw-Hill
P. 375
CHAPTER 32: Assessing the Circulation: Oximetry, Indicator Dilution, and Pulse Contour Analysis 245
pressure measurement when discriminating patients with and without increased by muscle contraction, the De O 2 slope increases, whereas in the
values >85% suggest resuscitation setting of altered blood flow distribution the rate of global O delivery
cardiovascular insufficiency. St O 2 2
values <60% reflect slope is dependent on
adequacy whereas in trauma patients persistent St O 2 is decreased. Sepsis decreases the De O 2 . The Re O 2
a poor outcome. Although this poor discrimination is disappointing, how low St O 2 is at the time of release, being less steep if St O 2 is above 40%
24
these data are reasonable and expected because a primary goal of than if the recovery starts at 30%, suggesting that the magnitude of the
as constant as possible by combined ischemic signal determines maximal local vasodilation. This dynamic
autoregulation is to maintain St O 2
increased local flow to match increased metabolic demand and decrease technique has been used to assess circulatory sufficiency in patients with
remains trauma, sepsis and during weaning from mechanical ventilation. 26-28
local metabolic rate if flow decreases such that baseline St O 2
within the normal range until shock is quite advanced. Importantly, St O 2
covaries best with local venous O saturation. Thus, measuring local
2
noninvasively is a potentially valuable tool in the assessment of Tissue O saturation (St O 2 ) varies little until severe tissue hypoperfusion occurs.
2
St O 2
compartment syndromes. 19,23,27 St O 2 coupled to a VOT allows one to diagnose circulatory stress before hypotension develops.
However, the addition of a dynamic vascular occlusion test (VOT)
that induces a controlled local ischemic challenge with subsequent
release has been shown to markedly improve and expand the predictive CARDIAC OUTPUT
to identify tissue hypoperfusion. The VOT measures the
28
ability of St O 2 to meet the body’s metabolic demand
effect of total vascular occlusion-induced tissue ischemia and release on Shock reflects an inadequate D O 2 . Indeed, except for
is measured on the thenar eminence because the and cardiac output is a primary determinant of D O 2
downstream St O 2 . St O 2 that occurs
subcutaneous tissue thickness is small and similar across subjects and extreme hypoxemia and anemia, most of the increase in D O 2
with resuscitation and normal biological adaptation is due to increasing
the thenar muscles are easily subjected to isolated ischemic challenge by cardiac output. Since cardiac output should vary to match metabolic
simple forearm sphygmomanometer inflation similar to that done when varies with demand), there is no “normal” cardiac out-
measuring systemic blood pressure. demands (ie, D O 2
put. Cardiac output is merely adequate or inadequate to meet the meta-
■ St O VASCULAR OCCLUSION TEST bolic demands of the body. Measures other than cardiac output need to
be made to ascertain if the measured cardiac output values are adequate
2
• The arm vessels are transiently, rapidly occluded by sphygmoma- to meet metabolic demands. Presently, the acute care provider has a vast
nometer inflation to 30 mm Hg above systolic pressure. This prevents array of devices, both invasive and noninvasive, that assess cardiac output
significant blood volume shifts between baseline and vascular occlu- accurately enough to drive clinical decision making. The discussion that
sion states. follows will be limited to invasive hemodynamic monitoring using central
• The vascular occlusion is sustained for either a defined time interval venous, pulmonary arterial, and arterial catheterization but many other
declines to some threshold minimal value devices using ultrasound, plethysmographic signals, CO rebreathing,
2
(eg, 3 minutes) or until St O 2 and thoracic electrical impedance and bioreactance are commercially
(usually <40%). available to accomplish the same tasks. These devices are briefly reviewed
increase recorded.
3
• Then, the occlusion is released and the rate of St O 2 elsewhere. Importantly, none of these devices actually measures cardiac
), output, they merely estimate it using assumptions of presumed physics
• From this maneuver one can obtain the rate of deoxygenation (De O 2
which reflects the local metabolic rate and blood flow distribution. and physiology as applied to humans. The two most common catheter-
as it rises following release of vascular occlusion related methods of estimating cardiac output are indicator dilution and
The slope of St O 2
), a function of the time arterial pulse contour analysis.
characterizes the rate of reoxygenation (Re O 2
reflects on the adequacy
required to wash out stagnant blood. Re O 2
of local cardiovascular reserve and microcirculatory flow (Fig. 32-3)
There is no “normal” cardiac output (Q ˙ t).
response derives from the functional hemodynamic
The VOT St O 2 Q ˙ t is either adequate or inadequate.
monitoring concept, in which the response of a system to a predeter-
29
30 is a function Other measures besides Q ˙ t define adequacy.
mined stress is the monitored variable. The rate of De O 2
of local metabolic rate and blood flow distribution. If metabolic rate is
■ INDICATOR DILUTION METHODS TO ASSESS CARDIAC OUTPUT
The principle of indicator dilution cardiac output measures is that if a small
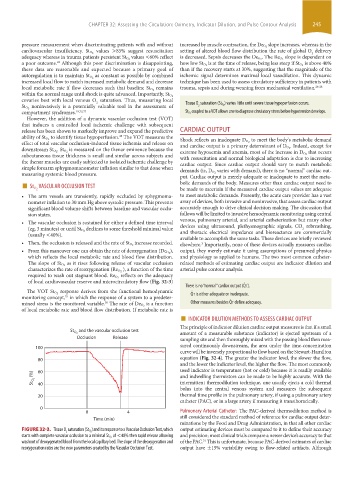
St and the vascular occlusion test
O 2 amount of a measurable substance (indicator) is ejected upstream of a
Occlusion Release sampling site and then thoroughly mixed with the passing blood then mea-
sured continuously downstream, the area under the time-concentration
100
curve will be inversely proportional to flow based on the Stewart-Hamilton
80 equation (Fig. 32-4). The greater the indicator level, the slower the flow,
and the lower the indicator level, the higher the flow. The most commonly
used indicator is temperature (hot or cold) because it is readily available
St O 2 (%) 60 and indwelling thermistors can be made to be highly accurate. With the
intermittent thermodilution technique, one usually ejects a cold thermal
40
bolus into the central venous system and measures the subsequent
20 thermal time profile in the pulmonary artery, if using a pulmonary artery
catheter (PAC), or in a large artery if measuring it transthoracically.
0 Pulmonary Arterial Catheter: The PAC-derived thermodilution method is
0 4
Time (min) still considered the standard method of reference for cardiac output deter-
minations by the Food and Drug Administration, in that all other cardiac
) and its response to a Vascular Occlusion Test, which output estimating devices must be compared to it to define their accuracy
FIGURE 32-3. Tissue O saturation (St O 2
2
of <40% then rapid release allowing and precision; most clinical trials compare a newer device’s accuracy to that
starts with complete vascular occlusion to a minimal St O 2
31
washout of deoxygenated blood from the local capillary bed. The slope of the deoxygenation and of the PAC. This is unfortunate, because PAC-derived estimates of cardiac
reoxygenation rates are the new parameters created by the Vascular Occlusion Test. output have ±15% variability owing to flow-related artifacts. Although
section03.indd 245 1/23/2015 2:06:49 PM